Applied Statistics
1MS926, Spring 2019, Uppsala University
©2019 Raazesh Sainudiin. Attribution 4.0 International (CC BY 4.0)
00. Introduction
- Introduction
- What is SageMath and why are we using it?
- Interaction - learning/teaching style
- What can you expect to get out of this course?
Introduction
See Applied Statistics for learning outcomes, content, assessment, etc.
Assessment:
- Three Computer Lab Assessments (attendance will be taken in the Labs)
- Final Exam will be in Computer Lab
What is SageMath and why are we using it?
We will be using Sage or SageMath for our hands-on work in this course. Sage is a free open-source mathematics software system licensed under the GPL. Sage can be used to study mathematics and statistics, including algebra, calculus, elementary to very advanced number theory, cryptography, commutative algebra, group theory, combinatorics, graph theory, exact linear algebra, optimization, interactive data visualization, randomized or Monte Carlo algorithms, scientific and statistical computing and much more. It combines various software packages into an integrative learning, teaching and research experience that is well suited for novice as well as professional researchers.
Sage is a set of software libraries built on top of Python, a widely used general purpose programming language. Sage greatly enhance Python's already mathematically friendly nature. It is one of the languages used at Google, US National Aeronautic and Space Administration (NASA), US Jet Propulsion Laboratory (JPL), Industrial Light and Magic, YouTube, and other leading entities in industry and public sectors. Scientists, engineers, and mathematicians often find it well suited for their work. Obtain a more thorough rationale for Sage from Why Sage? and Success Stories, Testimonials and News Articles. Jump start your motivation by taking a Sage Feature Tour right now!
Interaction - learning/teaching style
This is an interactive jupyter notebook with SageMath interpreter and interactive means...
Videos
We will embed relevant videos in the notebook, such as those from The Khan Academy or open MOOCs from google, facebook, academia, etc.
- watch Google's Hal Varian's 'statistics is the dream' job speech
- watch UC Berkeley Professor Michael Jordan's speech on 'The Data Science Revolution'
Latex
We will formally present mathematical and statistical concepts in the Notebook using Latex as follows:
$$ \sum_{i=1}^5 i = 1+2+3+4+5=15, \qquad \prod_{i=3}^6 i = 3 \times 4 \times 5 \times 6 = 360 $$
$$ \binom{n}{k}:= \frac{n!}{k!(n-k)!}, \qquad \lim_{x \to \infty}\exp{(-x)} = 0 $$
$$ \{\alpha, \beta, \gamma, \delta, \epsilon, \zeta, \mu,\theta, \vartheta, \phi, \varphi, \omega, \sigma, \varsigma,\Gamma, \Delta, \Theta, \Phi, \Omega\}, \qquad \forall x \in X, \quad \exists y \leq \epsilon, \ldots $$
Interactive Visualizations
We will use interactive visualisations to convey concepts when possible. See the Taylor approximation below for a given order.
var('x')
x0  = 0
f   = sin(x)*e^(-x)
p   = plot(f,-1,5, thickness=2)
dot = point((x0,f(x=x0)),pointsize=80,rgbcolor=(1,0,0))
@interact
def _(order=[1..12]):
    ft = f.taylor(x,x0,order)
    pt = plot(ft,-1, 5, color='green', thickness=2)
    pretty_print(html('$f(x)\;=\;%s$'%latex(f)))
    pretty_print(html('$\hat{f}(x;%s)\;=\;%s+\mathcal{O}\
                 (x^{%s})$'%(x0,latex(ft),order+1)))
    show(dot + p + pt, ymin = -.5, ymax = 1, figsize=[6,3])
Lab-Lecture Style of Teaching-Learning
We will write computer programs within code cells in the Notebook right after we learn the mathematical and statistical concepts.
Thus, there is a significant overlap between traditional lectures and labs in this course -- in fact these interactions are lab-lectures.
Live Data Explorations and Modeling
Let us visualize the CO2 data, fetched from US NOAA, and do a simple linear regression.
# Author: Marshall Hampton
import urllib2 as U
import scipy.stats as Stat
from IPython.display import HTML
co2data = U.urlopen(\
          'ftp://ftp.cmdl.noaa.gov/ccg/co2/trends/co2_mm_mlo.txt'\
                   ).readlines()
datalines = []
for a_line in co2data:
    if a_line.find('Creation:') != -1:
        cdate = a_line
    if a_line[0] != '#':
        temp = a_line.replace('\n','').split(' ')
        temp = [float(q) for q in temp if q != '']
        datalines.append(temp)
trdf = RealField(16)
@interact
def mauna_loa_co2(start_date = slider(1958,2018,1,1958), \
                  end_date = slider(1958, 2018,1,2018)):
    htmls1 = '<h3>CO2 monthly averages at Mauna Loa (interpolated),\
    from NOAA/ESRL data</h3>'
    htmls2 = '<h4>'+cdate+'</h4>'
    sel_data = [[q[2],q[4]] for q in datalines if start_date < \
                q[2] < end_date]
    c_max = max([q[1] for q in sel_data])
    c_min = min([q[1] for q in sel_data])
    slope, intercept, r, ttprob, stderr = Stat.linregress(sel_data)
    pretty_print(html(htmls1+htmls2+'<h4>Linear regression slope: '\
                      + str(trdf(slope))+ \
                      ' ppm/year; correlation coefficient: ' +\
                      str(trdf(r)) + '</h4>'))
    var('x,y')
    show(list_plot(sel_data, plotjoined=True, rgbcolor=(1,0,0))
                   + plot(slope*x+intercept,start_date,end_date),
                      xmin = start_date, ymin = c_min-2, axes = True, \
                      xmax = end_date, ymax = c_max+3, \
                      frame = False, figsize=[8,3])
We will use publicly available resources generously!
Here is an image of number systems from Wikipedia.

We will also sometimes embed whole wikipedia pages. Expect cached wikipedia pages in your final exam. The curse will prepare you to think from facts in publicly available information.
def showURL(url, ht=500):
    """Return an IFrame of the url to show in notebook \
       with height ht"""
    from IPython.display import IFrame
    return IFrame(url, width='95%', height=ht)
showURL('https://en.wikipedia.org/wiki/Number',400)
What can you expect to get out of this course?
Strengthen your foundations in:
- probability and statistics,
- computing and data analysis
in order to understand the probabilistic models and statistical inference procedures as well implement computer programs for processing raw data - a crucial distinguishing skillset of a modern applied statistician, i.e., a data scientist who knows her/his probabilistic and statistical foundations.
What is Data Science?
We will steer clear of academic/philosophical discussions on "what is data science?" and focus instead on the core skillset in mathematics, statistics and computing that is expected in a typical data science job today.
showURL("https://en.wikipedia.org/wiki/Data_science")
Course Structure
There will be 12 "lab-lectures" where I will be using .ipynb or IPython notebooks like this and 3 dedicated computer laboratories.
We will start with basics of programming in BASH and a review of Python before recollecting concepts in probability and setting the stage for applied statistics, including, hypothesis testing and parameter estimation.
Connection to Statistical Machine Learning and AI: An immediate application of paramter estimation in statistical machine learning (SML) and artifical intelligence (AI), where you apply more sophisticated methods than what you will learn here, is prediction. This course will prepare you for SML and AI.
STS also stands for Society
As STS students, you have the natural responsibility to ask questions such as: what is the cost of such sophisticated prediction algorithms on our society and planet?
Here your first assigned reading is from the following work:
- https://anatomyof.ai/, "Anatomy of an AI System" By Kate Crawford and Vladan Joler (2018)
The Amazon Echo as an anatomical map of human labor, data and planetary resources. Download the detailed ai-anatomy-map.pdf.
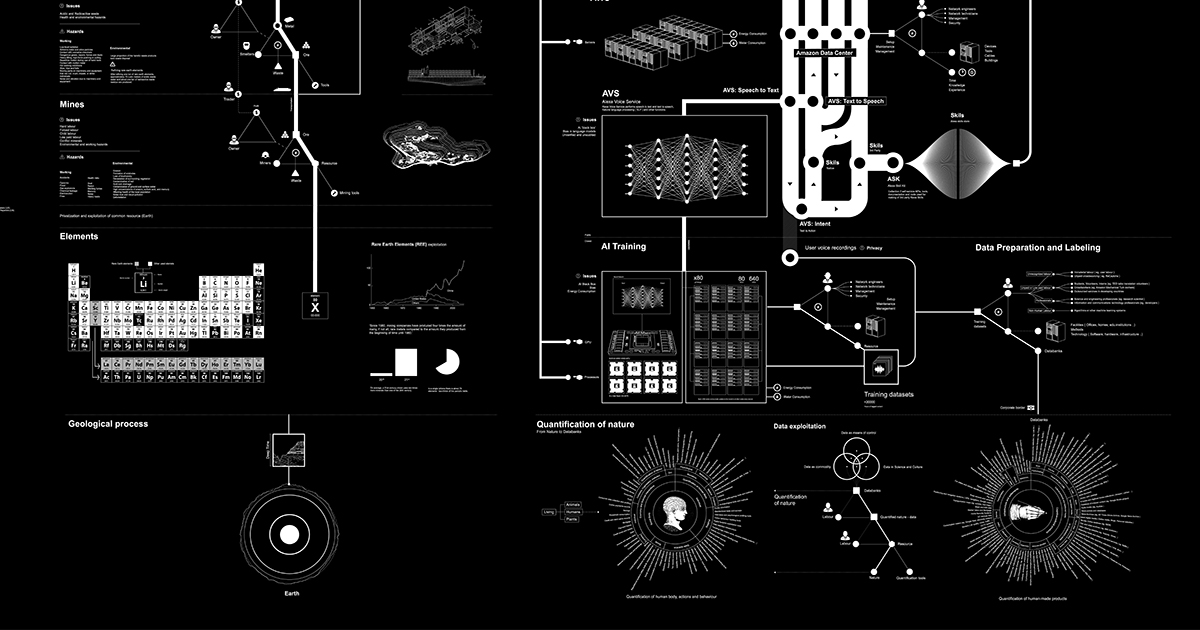
Given that you are in the civil engineering programme in systems in technology and society, spend some time reading the following:
- https://anatomyof.ai/, "Anatomy of an AI System" By Kate Crawford and Vladan Joler (2018)
Answer whether each of the following statements is True or False according to the authors by appropriately replacing Xxxxx coresponding to TruthValueOfStatement0a, TruthValueOfStatement0b and TruthValueOfStatement0c, respectively, in the next cell to demonstrate your reading comprehension.
Statement0a =Each small moment of convenience (provided by Amazon's Echo) – be it answering a question, turning on a light, or playing a song – requires a vast planetary network, fueled by the extraction of non-renewable materials, labor, and data.Statement0b =The Echo user is simultaneously a consumer, a resource, a worker, and a productStatement0c =Many of the assumptions about human life made by machine learning systems are narrow, normative and laden with error. Yet they are inscribing and building those assumptions into a new world, and will increasingly play a role in how opportunities, wealth, and knowledge are distributed.
# Replace Xxxxx with True or False; Don't modify anything else in this cell!

TruthValueOfStatement0a = Xxxxx

TruthValueOfStatement0b = Xxxxx

TruthValueOfStatement0c = Xxxxx
Local Test for Assignment 1, PROBLEM 0
Evaluate cell below to make sure your answer is valid. You should not modify anything in the cell below when evaluating it to do a local test of your solution.
# Test locally to ensure an acceptable answer, True or False
try:
    assert(isinstance(TruthValueOfStatement0a, bool))
    assert(isinstance(TruthValueOfStatement0b, bool))
    assert(isinstance(TruthValueOfStatement0c, bool))
    print("Good, you have answered either True or False. Hopefully they are the correct answers!")
except AssertionError:
    print("Try again. You are not writing True or False for your answers.")
NonAutoGraded
Summarise in 50-100 words your thoughts after reading https://anatomyof.ai/, "Anatomy of an AI System" By Kate Crawford and Vladan Joler (2018)
You can double-click this cell and start writing your summary below between the two --- lines in English. When you are done just CTRL-Enter (press down the ctrl key and hit the Enter key) to see how it looks in display mode.