// Databricks notebook source exported at Tue, 28 Jun 2016 08:45:47 UTC
Scalable Data Science
prepared by Raazesh Sainudiin and Sivanand Sivaram
supported by  and
and

The html source url of this databricks notebook and its recorded Uji  :
:
This is an augmentation of http://go.databricks.com/hubfs/notebooks/3-GraphFrames-User-Guide-scala.html
See:
- https://amplab.cs.berkeley.edu/wp-content/uploads/2014/09/graphx.pdf
- https://amplab.github.io/graphx/
- https://spark.apache.org/docs/latest/graphx-programming-guide.html
- https://databricks.com/blog/2016/03/03/introducing-graphframes.html
- https://databricks.com/blog/2016/03/16/on-time-flight-performance-with-spark-graphframes.html
- http://ampcamp.berkeley.edu/big-data-mini-course/graph-analytics-with-graphx.html
//This allows easy embedding of publicly available information into any other notebook
//when viewing in git-book just ignore this block - you may have to manually chase the URL in frameIt("URL").
//Example usage:
// displayHTML(frameIt("https://en.wikipedia.org/wiki/Latent_Dirichlet_allocation#Topics_in_LDA",250))
def frameIt( u:String, h:Int ) : String = {
      """<iframe
 src=""""+ u+""""
 width="95%" height="""" + h + """"
 sandbox>
  <p>
    <a href="http://spark.apache.org/docs/latest/index.html">
      Fallback link for browsers that, unlikely, don't support frames
    </a>
  </p>
</iframe>"""
   }
displayHTML(frameIt("https://amplab.github.io/graphx/",700))
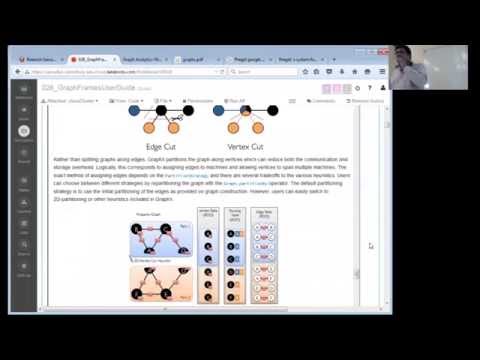
displayHTML(frameIt("https://spark.apache.org/docs/latest/graphx-programming-guide.html#optimized-representation",800))
#GraphFrames User Guide (Scala)
GraphFrames is a package for Apache Spark which provides DataFrame-based Graphs. It provides high-level APIs in Scala, Java, and Python. It aims to provide both the functionality of GraphX and extended functionality taking advantage of Spark DataFrames. This extended functionality includes motif finding, DataFrame-based serialization, and highly expressive graph queries.
The GraphFrames package is available from Spark Packages.
This notebook demonstrates examples from the GraphFrames User Guide.
displayHTML(frameIt("https://databricks.com/blog/2016/03/03/introducing-graphframes.html",500))
import org.apache.spark.sql._
import org.apache.spark.sql.functions._

import org.graphframes._
##Creating GraphFrames
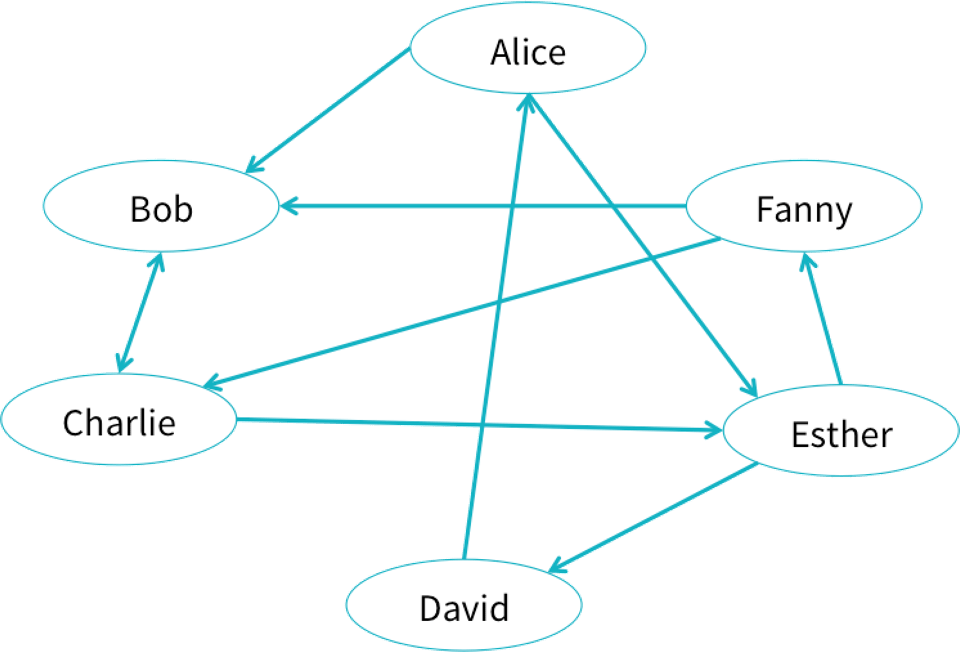
Let us try to create an example social network from the blog:
Users can create GraphFrames from vertex and edge DataFrames.
- Vertex DataFrame: A vertex DataFrame should contain a special column named
idwhich specifies unique IDs for each vertex in the graph. - Edge DataFrame: An edge DataFrame should contain two special columns:
src(source vertex ID of edge) anddst(destination vertex ID of edge).
Both DataFrames can have arbitrary other columns. Those columns can represent vertex and edge attributes.
In our example, we can use a GraphFrame can store data or properties associated with each vertex and edge.
In our social network, each user might have an age and name, and each connection might have a relationship type.
Create the vertices and edges
// Vertex DataFrame
val v = sqlContext.createDataFrame(List(
  ("a", "Alice", 34),
  ("b", "Bob", 36),
  ("c", "Charlie", 30),
  ("d", "David", 29),
  ("e", "Esther", 32),
  ("f", "Fanny", 36),
  ("g", "Gabby", 60)
)).toDF("id", "name", "age")
// Edge DataFrame
val e = sqlContext.createDataFrame(List(
  ("a", "b", "friend"),
  ("b", "c", "follow"),
  ("c", "b", "follow"),
  ("f", "c", "follow"),
  ("e", "f", "follow"),
  ("e", "d", "friend"),
  ("d", "a", "friend"),
  ("a", "e", "friend")
)).toDF("src", "dst", "relationship")
Let’s create a graph from these vertices and these edges:
val g = GraphFrame(v, e)
Let’s use the d3.graphs to visualise graphs (recall the D3 graphs in wiki-click example).
package d3
// We use a package object so that we can define top level classes like Edge that need to be used in other cells
import org.apache.spark.sql._
import com.databricks.backend.daemon.driver.EnhancedRDDFunctions.displayHTML
case class Edge(src: String, dest: String, count: Long)
case class Node(name: String)
case class Link(source: Int, target: Int, value: Long)
case class Graph(nodes: Seq[Node], links: Seq[Link])
object graphs {
val sqlContext = SQLContext.getOrCreate(org.apache.spark.SparkContext.getOrCreate())
import sqlContext.implicits._
def force(clicks: Dataset[Edge], height: Int = 100, width: Int = 960): Unit = {
val data = clicks.collect()
val nodes = (data.map(_.src) ++ data.map(_.dest)).map(_.replaceAll("_", " ")).toSet.toSeq.map(Node)
val links = data.map { t =>
Link(nodes.indexWhere(_.name == t.src.replaceAll("_", " ")), nodes.indexWhere(_.name == t.dest.replaceAll("_", " ")), t.count / 20 + 1)
}
showGraph(height, width, Seq(Graph(nodes, links)).toDF().toJSON.first())
}
/**
* Displays a force directed graph using d3
* input: {"nodes": [{"name": "..."}], "links": [{"source": 1, "target": 2, "value": 0}]}
*/
def showGraph(height: Int, width: Int, graph: String): Unit = {
displayHTML(s"""
<!DOCTYPE html>
<html>
<head>
<meta http-equiv="Content-Type" content="text/html; charset=UTF-8">
<title>Polish Books Themes - an Interactive Map</title>
<meta charset="utf-8">
<style>
.node_circle {
stroke: #777;
stroke-width: 1.3px;
}
.node_label {
pointer-events: none;
}
.link {
stroke: #777;
stroke-opacity: .2;
}
.node_count {
stroke: #777;
stroke-width: 1.0px;
fill: #999;
}
text.legend {
font-family: Verdana;
font-size: 13px;
fill: #000;
}
.node text {
font-family: "Helvetica Neue","Helvetica","Arial",sans-serif;
font-size: 17px;
font-weight: 200;
}
</style>
</head>
<body>
<script src="//d3js.org/d3.v3.min.js"></script>
<script>
var graph = $graph;
var width = $width,
height = $height;
var color = d3.scale.category20();
var force = d3.layout.force()
.charge(-700)
.linkDistance(180)
.size([width, height]);
var svg = d3.select("body").append("svg")
.attr("width", width)
.attr("height", height);
force
.nodes(graph.nodes)
.links(graph.links)
.start();
var link = svg.selectAll(".link")
.data(graph.links)
.enter().append("line")
.attr("class", "link")
.style("stroke-width", function(d) { return Math.sqrt(d.value); });
var node = svg.selectAll(".node")
.data(graph.nodes)
.enter().append("g")
.attr("class", "node")
.call(force.drag);
node.append("circle")
.attr("r", 10)
.style("fill", function (d) {
if (d.name.startsWith("other")) { return color(1); } else { return color(2); };
})
node.append("text")
.attr("dx", 10)
.attr("dy", ".35em")
.text(function(d) { return d.name });
//Now we are giving the SVGs co-ordinates - the force layout is generating the co-ordinates which this code is using to update the attributes of the SVG elements
force.on("tick", function () {
link.attr("x1", function (d) {
return d.source.x;
})
.attr("y1", function (d) {
return d.source.y;
})
.attr("x2", function (d) {
return d.target.x;
})
.attr("y2", function (d) {
return d.target.y;
});
d3.selectAll("circle").attr("cx", function (d) {
return d.x;
})
.attr("cy", function (d) {
return d.y;
});
d3.selectAll("text").attr("x", function (d) {
return d.x;
})
.attr("y", function (d) {
return d.y;
});
});
</script>
</html>
""")
}
def help() = {
displayHTML("""
<p>
Produces a force-directed graph given a collection of edges of the following form:</br>
<tt><font color="#a71d5d">case class</font> <font color="#795da3">Edge</font>(<font color="#ed6a43">src</font>: <font color="#a71d5d">String</font>, <font color="#ed6a43">dest</font>: <font color="#a71d5d">String</font>, <font color="#ed6a43">count</font>: <font color="#a71d5d">Long</font>)</tt>
</p>
<p>Usage:<br/>
<tt><font color="#a71d5d">import</font> <font color="#ed6a43">d3._</font></tt><br/>
<tt><font color="#795da3">graphs.force</font>(</br>
<font color="#ed6a43">height</font> = <font color="#795da3">500</font>,<br/>
<font color="#ed6a43">width</font> = <font color="#795da3">500</font>,<br/>
<font color="#ed6a43">clicks</font>: <font color="#795da3">Dataset</font>[<font color="#795da3">Edge</font>])</tt>
</p>""")
}
}
d3.graphs.help()
import org.apache.spark.sql.functions.lit // import the lit function in sql
val gE= g.edges.select($"src", $"dst".as("dest"), lit(1L).as("count")) // for us the column count is just an edge incidence
display(gE)
d3.graphs.force(
  height = 500,
  width = 500,
  clicks = gE.as[d3.Edge])
// This example graph also comes with the GraphFrames package.
val g0 = examples.Graphs.friends
d3.graphs.force( // let us see g0 now in one cell
  height = 500,
  width = 500,
  clicks = g0.edges.select($"src", $"dst".as("dest"), lit(1L).as("count")).as[d3.Edge])
Basic graph and DataFrame queries
GraphFrames provide several simple graph queries, such as node degree.
Also, since GraphFrames represent graphs as pairs of vertex and edge DataFrames, it is easy to make powerful queries directly on the vertex and edge DataFrames. Those DataFrames are made available as vertices and edges fields in the GraphFrame.
Simple queries are simple
GraphFrames make it easy to express queries over graphs. Since GraphFrame vertices and edges are stored as DataFrames, many queries are just DataFrame (or SQL) queries.
display(g.vertices)
display(g0.vertices) // this is the same query on the graph loaded as an example from GraphFrame package
display(g.edges)
The incoming degree of the vertices:
display(g.inDegrees)
The outgoing degree of the vertices:
display(g.outDegrees)
The degree of the vertices:
display(g.degrees)
You can run queries directly on the vertices DataFrame. For example, we can find the age of the youngest person in the graph:
val youngest = g.vertices.groupBy().min("age")
display(youngest)
Likewise, you can run queries on the edges DataFrame.
For example, let us count the number of ‘follow’ relationships in the graph:
val numFollows = g.edges.filter("relationship = 'follow'").count()
##Motif finding
More complex relationships involving edges and vertices can be built using motifs.
The following cell finds the pairs of vertices with edges in both directions between them.
The result is a dataframe, in which the column names are given by the motif keys.
Check out the GraphFrame User Guide for more details on the API.
// Search for pairs of vertices with edges in both directions between them, i.e., find undirected or bidirected edges.
val motifs = g.find("(a)-[e1]->(b); (b)-[e2]->(a)")
display(motifs)
Since the result is a DataFrame, more complex queries can be built on top of the motif.
Let us find all the reciprocal relationships in which one person is older than 30:
val filtered = motifs.filter("b.age > 30")
display(filtered)
You Try!
//Search for all "directed triangles" or triplets of vertices: a,b,c with edges: a->b, b->c and c->a
//uncomment the next 2 lines and replace the "..." below
val motifs3 = g.find("(a)-[e1]->(b); (b)-[e2]->(c); (c)-[e3]->(a) ")
display(motifs3)
Stateful queries
Many motif queries are stateless and simple to express, as in the examples above. The next examples demonstrate more complex queries which carry state along a path in the motif. These queries can be expressed by combining GraphFrame motif finding with filters on the result, where the filters use sequence operations to construct a series of DataFrame Columns.
For example, suppose one wishes to identify a chain of 4 vertices with some property defined by a sequence of functions. That is, among chains of 4 vertices a->b->c->d, identify the subset of chains matching this complex filter:
- Initialize state on path.
- Update state based on vertex a.
- Update state based on vertex b.
- Etc. for c and d.
- If final state matches some condition, then the chain is accepted by the filter.
The below code snippets demonstrate this process, where we identify chains of 4 vertices such that at least 2 of the 3 edges are friend relationships. In this example, the state is the current count of friend edges; in general, it could be any DataFrame Column.
// Find chains of 4 vertices.
val chain4 = g.find("(a)-[ab]->(b); (b)-[bc]->(c); (c)-[cd]->(d)")

// Query on sequence, with state (cnt)
//  (a) Define method for updating state given the next element of the motif.
def sumFriends(cnt: Column, relationship: Column): Column = {
  when(relationship === "friend", cnt + 1).otherwise(cnt)
}
//  (b) Use sequence operation to apply method to sequence of elements in motif.
//      In this case, the elements are the 3 edges.
val condition = Seq("ab", "bc", "cd").
  foldLeft(lit(0))((cnt, e) => sumFriends(cnt, col(e)("relationship")))
//  (c) Apply filter to DataFrame.
val chainWith2Friends2 = chain4.where(condition >= 2)
display(chainWith2Friends2)
###Subgraphs
Subgraphs are built by filtering a subset of edges and vertices. For example, the following subgraph only contains people who are friends and who are more than 30 years old.
// Select subgraph of users older than 30, and edges of type "friend"
val v2 = g.vertices.filter("age > 30")
val e2 = g.edges.filter("relationship = 'friend'")
val g2 = GraphFrame(v2, e2)
display(g2.vertices)
display(g2.edges)
d3.graphs.force( // let us see g2 now in one cell
  height = 500,
  width = 500,
  clicks = g2.edges.select($"src", $"dst".as("dest"), lit(1L).as("count")).as[d3.Edge])
Complex triplet filters
The following example shows how to select a subgraph based upon triplet filters which operate on:
- an edge and
- its src and
- dst vertices.
This example could be extended to go beyond triplets by using more complex motifs.
// Select subgraph based on edges "e" of type "follow"
// pointing from a younger user "a" to an older user "b".
val paths = g.find("(a)-[e]->(b)")
  .filter("e.relationship = 'follow'")
  .filter("a.age < b.age")
// "paths" contains vertex info. Extract the edges.
val e2 = paths.select("e.src", "e.dst", "e.relationship")
// In Spark 1.5+, the user may simplify this call:
//  val e2 = paths.select("e.*")

// Construct the subgraph
val g2 = GraphFrame(g.vertices, e2)
display(g2.vertices)
display(g2.edges)
Standard graph algorithms
GraphFrames comes with a number of standard graph algorithms built in:
- Breadth-first search (BFS)
- Connected components
- Strongly connected components
- Label Propagation Algorithm (LPA)
- PageRank
- Shortest paths
- Triangle count
Breadth-first search (BFS)
displayHTML(frameIt("http://graphframes.github.io/user-guide.html#breadth-first-search-bfs",500))
Search from “Esther” for users of age < 32.
val paths: DataFrame = g.bfs.fromExpr("name = 'Esther'").toExpr("age < 32").run()
display(paths)
The search may also be limited by edge filters and maximum path lengths.
val filteredPaths = g.bfs.fromExpr("name = 'Esther'").toExpr("age < 32")
  .edgeFilter("relationship != 'friend'")
  .maxPathLength(3)
  .run()
display(filteredPaths)
###Connected components
Compute the connected component membership of each vertex and return a graph with each vertex assigned a component ID.
displayHTML(frameIt("http://graphframes.github.io/user-guide.html#connected-components",500))
val result = g.connectedComponents.run() // doesn't work on Spark 1.4
display(result)
Fun Exercise: Try to modify the d3.graph function to allow a visualisation of a given Sequence of component ids in the above result.
##Strongly connected components
Compute the strongly connected component (SCC) of each vertex and return a graph with each vertex assigned to the SCC containing that vertex.
displayHTML(frameIt("http://graphframes.github.io/user-guide.html#strongly-connected-components",500))
val result = g.stronglyConnectedComponents.maxIter(10).run()
display(result.orderBy("component"))
##Label propagation
Run static Label Propagation Algorithm for detecting communities in networks.
Each node in the network is initially assigned to its own community. At every superstep, nodes send their community affiliation to all neighbors and update their state to the mode community affiliation of incoming messages.
LPA is a standard community detection algorithm for graphs. It is very inexpensive computationally, although
- (1) convergence is not guaranteed and
- (2) one can end up with trivial solutions (all nodes are identified into a single community).
displayHTML(frameIt("http://graphframes.github.io/user-guide.html#label-propagation-algorithm-lpa",600))
val result = g.labelPropagation.maxIter(5).run()
display(result.orderBy("label"))
##PageRank
Identify important vertices in a graph based on connections.
displayHTML(frameIt("http://graphframes.github.io/user-guide.html#pagerank",600))
// Run PageRank until convergence to tolerance "tol".
val results = g.pageRank.resetProbability(0.15).tol(0.01).run()
display(results.vertices)
display(results.edges)
// Run PageRank for a fixed number of iterations.
val results2 = g.pageRank.resetProbability(0.15).maxIter(10).run()
display(results2.vertices)
// Run PageRank personalized for vertex "a"
val results3 = g.pageRank.resetProbability(0.15).maxIter(10).sourceId("a").run()
display(results3.vertices)
##Shortest paths
Computes shortest paths to the given set of landmark vertices, where landmarks are specified by vertex ID.
displayHTML(frameIt("http://graphframes.github.io/user-guide.html#shortest-paths",500))
val paths = g.shortestPaths.landmarks(Seq("a", "d")).run()
display(paths)
###Triangle count
Computes the number of triangles passing through each vertex.
displayHTML(frameIt("http://graphframes.github.io/user-guide.html#triangle-count",300))
val results = g.triangleCount.run()
display(results)
There is a lot more… dig into the docs to find out about belief propogation algorithm now!
displayHTML(frameIt("http://graphframes.github.io/user-guide.html#message-passing-via-aggregatemessages",700))
Scalable Data Science
prepared by Raazesh Sainudiin and Sivanand Sivaram
supported by
and