Distributed Vertex Programming using GraphX
This is an augmentation of http://go.databricks.com/hubfs/notebooks/3-GraphFrames-User-Guide-scala.html that was last retrieved in 2019.
See:
- https://amplab.cs.berkeley.edu/wp-content/uploads/2014/09/graphx.pdf
- https://amplab.github.io/graphx/
- https://spark.apache.org/docs/latest/graphx-programming-guide.html
- https://databricks.com/blog/2016/03/03/introducing-graphframes.html
- https://databricks.com/blog/2016/03/16/on-time-flight-performance-with-spark-graphframes.html
- http://ampcamp.berkeley.edu/big-data-mini-course/graph-analytics-with-graphx.html
And of course the databricks guide: * https://docs.databricks.com/spark/latest/graph-analysis/index.html
Use the source, Luke/Lea!
Community Packages in Spark - more generally
Let us recall the following quoate in Chapter 10 of High Performance Spark book (needs access to Orielly publishers via your library/subscription): - https://learning.oreilly.com/library/view/high-performance-spark/9781491943199/ch10.html#components
Beyond the integrated components, the community packages can add important functionality to Spark, sometimes even superseding built-in functionality—like with GraphFrames.
Here we introduce you to GraphFrames quickly so you don't need to drop down to the GraphX library that requires more understanding of caching and checkpointing to keep the vertex program's DAG from exploding or becoming inefficient.
GraphFrames User Guide (Scala)
GraphFrames is a package for Apache Spark which provides DataFrame-based Graphs. It provides high-level APIs in Scala, Java, and Python. It aims to provide both the functionality of GraphX and extended functionality taking advantage of Spark DataFrames. This extended functionality includes motif finding, DataFrame-based serialization, and highly expressive graph queries.
The GraphFrames package is available from Spark Packages.
This notebook demonstrates examples from the GraphFrames User Guide: https://graphframes.github.io/graphframes/docs/_site/user-guide.html.
sc.version // link the right library depending on Spark version of the cluster that's running
// spark version 2.3.0 works with graphframes:graphframes:0.7.0-spark2.3-s_2.11
// spark version 3.0.1 works with graphframes:graphframes:0.8.1-spark3.0-s_2.12
res1: String = 3.2.1
Since databricks.com stopped allowing IFrame embeds we have to open it in a separate window now. The blog is insightful and worth a perusal:
- https://databricks.com/blog/2016/03/03/introducing-graphframes.html
// we first need to install the library - graphframes as a Spark package - and attach it to our cluster - see note two cells above!
import org.apache.spark.sql._
import org.apache.spark.sql.functions._

import org.graphframes._
import org.apache.spark.sql._
import org.apache.spark.sql.functions._
import org.graphframes._
Creating GraphFrames
Let us try to create an example social network from the blog: * https://databricks.com/blog/2016/03/03/introducing-graphframes.html.
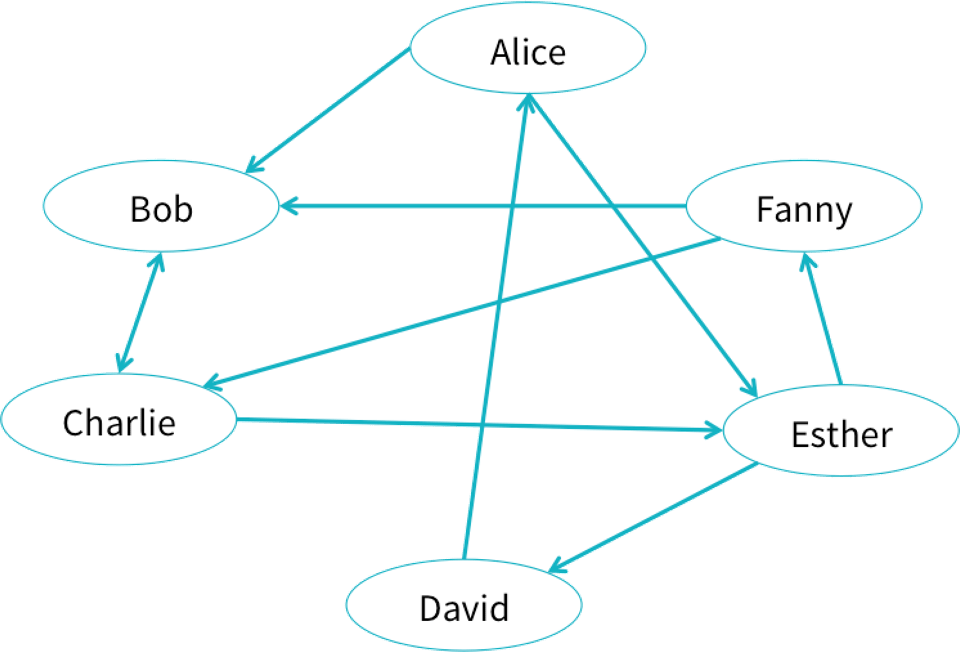
Users can create GraphFrames from vertex and edge DataFrames.
- Vertex DataFrame: A vertex DataFrame should contain a special column named
idwhich specifies unique IDs for each vertex in the graph. - Edge DataFrame: An edge DataFrame should contain two special columns:
src(source vertex ID of edge) anddst(destination vertex ID of edge).
Both DataFrames can have arbitrary other columns. Those columns can represent vertex and edge attributes.
In our example, we can use a GraphFrame can store data or properties associated with each vertex and edge.
In our social network, each user might have an age and name, and each connection might have a relationship type.
Create the vertices and edges
// Vertex DataFrame
val v = sqlContext.createDataFrame(List(
  ("a", "Alice", 34),
  ("b", "Bob", 36),
  ("c", "Charlie", 30),
  ("d", "David", 29),
  ("e", "Esther", 32),
  ("f", "Fanny", 36),
  ("g", "Gabby", 60)
)).toDF("id", "name", "age")

// Edge DataFrame
val e = sqlContext.createDataFrame(List(
  ("a", "b", "friend"),
  ("b", "c", "follow"),
  ("c", "b", "follow"),
  ("f", "c", "follow"),
  ("e", "f", "follow"),
  ("e", "d", "friend"),
  ("d", "a", "friend"),
  ("a", "e", "friend")
)).toDF("src", "dst", "relationship")
v: org.apache.spark.sql.DataFrame = [id: string, name: string ... 1 more field]
e: org.apache.spark.sql.DataFrame = [src: string, dst: string ... 1 more field]
Let's create a graph from these vertices and these edges:
val g = GraphFrame(v, e)
g: org.graphframes.GraphFrame = GraphFrame(v:[id: string, name: string ... 1 more field], e:[src: string, dst: string ... 1 more field])
Let's use the d3.graphs to visualise graphs (recall the D3 graphs in wiki-click example). You need the Run Cell below using that cell's Play button's drop-down menu.
Warning: classes defined within packages cannot be redefined without a cluster restart.
Compilation successful.
d3.graphs.help()
Produces a force-directed graph given a collection of edges of the following form: case class Edge(src: String, dest: String, count: Long)
Usage:
import d3._
graphs.force(
height = 500,
width = 500,
clicks: Dataset[Edge])
import org.apache.spark.sql.functions.lit // import the lit function in sql
val gE= g.edges.select($"src", $"dst".as("dest"), lit(1L).as("count")) // for us the column count is just an edge incidence
import org.apache.spark.sql.functions.lit
gE: org.apache.spark.sql.DataFrame = [src: string, dest: string ... 1 more field]
display(gE)
| src | dest | count |
|---|---|---|
| a | b | 1.0 |
| b | c | 1.0 |
| c | b | 1.0 |
| f | c | 1.0 |
| e | f | 1.0 |
| e | d | 1.0 |
| d | a | 1.0 |
| a | e | 1.0 |
d3.graphs.force(
  height = 500,
  width = 500,
  clicks = gE.as[d3.Edge])
// This example graph also comes with the GraphFrames package.
val g0 = examples.Graphs.friends
g0: org.graphframes.GraphFrame = GraphFrame(v:[id: string, name: string ... 1 more field], e:[src: string, dst: string ... 1 more field])
d3.graphs.force( // let us see g0 now in one cell
  height = 500,
  width = 500,
  clicks = g0.edges.select($"src", $"dst".as("dest"), lit(1L).as("count")).as[d3.Edge])
Basic graph and DataFrame queries
GraphFrames provide several simple graph queries, such as node degree.
Also, since GraphFrames represent graphs as pairs of vertex and edge DataFrames, it is easy to make powerful queries directly on the vertex and edge DataFrames. Those DataFrames are made available as vertices and edges fields in the GraphFrame.
Simple queries are simple
GraphFrames make it easy to express queries over graphs. Since GraphFrame vertices and edges are stored as DataFrames, many queries are just DataFrame (or SQL) queries.
display(g.vertices)
| id | name | age |
|---|---|---|
| a | Alice | 34.0 |
| b | Bob | 36.0 |
| c | Charlie | 30.0 |
| d | David | 29.0 |
| e | Esther | 32.0 |
| f | Fanny | 36.0 |
| g | Gabby | 60.0 |
display(g0.vertices) // this is the same query on the graph loaded as an example from GraphFrame package
| id | name | age |
|---|---|---|
| a | Alice | 34.0 |
| b | Bob | 36.0 |
| c | Charlie | 30.0 |
| d | David | 29.0 |
| e | Esther | 32.0 |
| f | Fanny | 36.0 |
| g | Gabby | 60.0 |
display(g.edges)
| src | dst | relationship |
|---|---|---|
| a | b | friend |
| b | c | follow |
| c | b | follow |
| f | c | follow |
| e | f | follow |
| e | d | friend |
| d | a | friend |
| a | e | friend |
The incoming degree of the vertices:
display(g.inDegrees)
| id | inDegree |
|---|---|
| c | 2.0 |
| b | 2.0 |
| f | 1.0 |
| e | 1.0 |
| d | 1.0 |
| a | 1.0 |
The outgoing degree of the vertices:
display(g.outDegrees)
| id | outDegree |
|---|---|
| f | 1.0 |
| c | 1.0 |
| b | 1.0 |
| a | 2.0 |
| e | 2.0 |
| d | 1.0 |
The degree of the vertices:
display(g.degrees)
| id | degree |
|---|---|
| f | 2.0 |
| c | 3.0 |
| b | 3.0 |
| a | 3.0 |
| e | 3.0 |
| d | 2.0 |
You can run queries directly on the vertices DataFrame. For example, we can find the age of the youngest person in the graph:
val youngest = g.vertices.groupBy().min("age")
display(youngest)
| min(age) |
|---|
| 29.0 |
Likewise, you can run queries on the edges DataFrame.
For example, let us count the number of 'follow' relationships in the graph:
val numFollows = g.edges.filter("relationship = 'follow'").count()
numFollows: Long = 4
Motif finding
More complex relationships involving edges and vertices can be built using motifs.
The following cell finds the pairs of vertices with edges in both directions between them.
The result is a dataframe, in which the column names are given by the motif keys.
Check out the GraphFrame User Guide at https://graphframes.github.io/graphframes/docs/_site/user-guide.html for more details on the API.
// Search for pairs of vertices with edges in both directions between them, i.e., find undirected or bidirected edges.
val motifs = g.find("(a)-[e1]->(b); (b)-[e2]->(a)")
display(motifs)
Since the result is a DataFrame, more complex queries can be built on top of the motif.
Let us find all the reciprocal relationships in which one person is older than 30:
val filtered = motifs.filter("b.age > 30")
display(filtered)
You Try!
//Search for all "directed triangles" or triplets of vertices: a,b,c with edges: a->b, b->c and c->a
//uncomment the next 2 lines and replace the "XXX" below
//val motifs3 = g.find("(a)-[e1]->(b); (b)-[e2]->(c); (c)-[e3]->(XXX)")
//display(motifs3)
Stateful queries
Many motif queries are stateless and simple to express, as in the examples above. The next examples demonstrate more complex queries which carry state along a path in the motif. These queries can be expressed by combining GraphFrame motif finding with filters on the result, where the filters use sequence operations to construct a series of DataFrame Columns.
For example, suppose one wishes to identify a chain of 4 vertices with some property defined by a sequence of functions. That is, among chains of 4 vertices a->b->c->d, identify the subset of chains matching this complex filter:
- Initialize state on path.
- Update state based on vertex a.
- Update state based on vertex b.
- Etc. for c and d.
- If final state matches some condition, then the chain is accepted by the filter.
The below code snippets demonstrate this process, where we identify chains of 4 vertices such that at least 2 of the 3 edges are friend relationships. In this example, the state is the current count of friend edges; in general, it could be any DataFrame Column.
// Find chains of 4 vertices.
val chain4 = g.find("(a)-[ab]->(b); (b)-[bc]->(c); (c)-[cd]->(d)")

// Query on sequence, with state (cnt)
//  (a) Define method for updating state given the next element of the motif.
def sumFriends(cnt: Column, relationship: Column): Column = {
  when(relationship === "friend", cnt + 1).otherwise(cnt)
}
//  (b) Use sequence operation to apply method to sequence of elements in motif.
//      In this case, the elements are the 3 edges.
val condition = Seq("ab", "bc", "cd").
  foldLeft(lit(0))((cnt, e) => sumFriends(cnt, col(e)("relationship")))
//  (c) Apply filter to DataFrame.
val chainWith2Friends2 = chain4.where(condition >= 2)
display(chainWith2Friends2)
chain4
res22: org.apache.spark.sql.DataFrame = [a: struct<id: string, name: string ... 1 more field>, ab: struct<src: string, dst: string ... 1 more field> ... 5 more fields]
chain4.printSchema
root
 |-- a: struct (nullable = false)
 |    |-- id: string (nullable = true)
 |    |-- name: string (nullable = true)
 |    |-- age: integer (nullable = false)
 |-- ab: struct (nullable = false)
 |    |-- src: string (nullable = true)
 |    |-- dst: string (nullable = true)
 |    |-- relationship: string (nullable = true)
 |-- b: struct (nullable = false)
 |    |-- id: string (nullable = true)
 |    |-- name: string (nullable = true)
 |    |-- age: integer (nullable = false)
 |-- bc: struct (nullable = false)
 |    |-- src: string (nullable = true)
 |    |-- dst: string (nullable = true)
 |    |-- relationship: string (nullable = true)
 |-- c: struct (nullable = false)
 |    |-- id: string (nullable = true)
 |    |-- name: string (nullable = true)
 |    |-- age: integer (nullable = false)
 |-- cd: struct (nullable = false)
 |    |-- src: string (nullable = true)
 |    |-- dst: string (nullable = true)
 |    |-- relationship: string (nullable = true)
 |-- d: struct (nullable = false)
 |    |-- id: string (nullable = true)
 |    |-- name: string (nullable = true)
 |    |-- age: integer (nullable = false)
An idea -- a diatribe into an AI security product.
Can you think of a way to use stateful queries in social media networks to find perpetrators of hate-speech online who are possibly worthy of an investigation by domain experts, say in the intelligence or security domain, for potential prosecution on charges of having incited another person to cause physical violence... This is a real problem today as Swedish law effectively prohibits certain forms of online hate-speech.
An idea for a product that can be used by Swedish security agencies?
See https://näthatsgranskaren.se/ for details of a non-profit in Sweden doing such operaitons mostly manually as of early 2020.
Subgraphs
Subgraphs are built by filtering a subset of edges and vertices. For example, the following subgraph only contains people who are friends and who are more than 30 years old.
// Select subgraph of users older than 30, and edges of type "friend"
val v2 = g.vertices.filter("age > 30")
val e2 = g.edges.filter("relationship = 'friend'")
val g2 = GraphFrame(v2, e2)
v2: org.apache.spark.sql.Dataset[org.apache.spark.sql.Row] = [id: string, name: string ... 1 more field]
e2: org.apache.spark.sql.Dataset[org.apache.spark.sql.Row] = [src: string, dst: string ... 1 more field]
g2: org.graphframes.GraphFrame = GraphFrame(v:[id: string, name: string ... 1 more field], e:[src: string, dst: string ... 1 more field])
display(g2.vertices)
| id | name | age |
|---|---|---|
| a | Alice | 34.0 |
| b | Bob | 36.0 |
| e | Esther | 32.0 |
| f | Fanny | 36.0 |
| g | Gabby | 60.0 |
display(g2.edges)
| src | dst | relationship |
|---|---|---|
| a | b | friend |
| e | d | friend |
| d | a | friend |
| a | e | friend |
d3.graphs.force( // let us see g2 now in one cell
  height = 500,
  width = 500,
  clicks = g2.edges.select($"src", $"dst".as("dest"), lit(1L).as("count")).as[d3.Edge])
Complex triplet filters
The following example shows how to select a subgraph based upon triplet filters which operate on:
- an edge and
- its src and
- dst vertices.
This example could be extended to go beyond triplets by using more complex motifs.
// Select subgraph based on edges "e" of type "follow"
// pointing from a younger user "a" to an older user "b".
val paths = g.find("(a)-[e]->(b)")
  .filter("e.relationship = 'follow'")
  .filter("a.age < b.age")
// "paths" contains vertex info. Extract the edges.
val e2 = paths.select("e.src", "e.dst", "e.relationship")
// In Spark 1.5+, the user may simplify this call:
//  val e2 = paths.select("e.*")

// Construct the subgraph
val g2 = GraphFrame(g.vertices, e2)
paths: org.apache.spark.sql.Dataset[org.apache.spark.sql.Row] = [a: struct<id: string, name: string ... 1 more field>, e: struct<src: string, dst: string ... 1 more field> ... 1 more field]
e2: org.apache.spark.sql.DataFrame = [src: string, dst: string ... 1 more field]
g2: org.graphframes.GraphFrame = GraphFrame(v:[id: string, name: string ... 1 more field], e:[src: string, dst: string ... 1 more field])
display(g2.vertices)
| id | name | age |
|---|---|---|
| a | Alice | 34.0 |
| b | Bob | 36.0 |
| c | Charlie | 30.0 |
| d | David | 29.0 |
| e | Esther | 32.0 |
| f | Fanny | 36.0 |
| g | Gabby | 60.0 |
display(g2.edges)
| src | dst | relationship |
|---|---|---|
| c | b | follow |
| e | f | follow |
Standard graph algorithms in GraphX conveniently via GraphFrames
GraphFrames comes with a number of standard graph algorithms built in:
- Breadth-first search (BFS)
- Connected components
- Strongly connected components
- Label Propagation Algorithm (LPA)
- PageRank
- Shortest paths
- Triangle count
Read
https://graphframes.github.io/graphframes/docs/_site/user-guide.html
Search from "Esther" for users of age < 32.
// Search from "Esther" for users of age <= 32.
val paths: DataFrame = g.bfs.fromExpr("name = 'Esther'").toExpr("age < 32").run()
display(paths)
val paths: DataFrame = g.bfs.fromExpr("name = 'Esther' OR name = 'Bob'").toExpr("age < 32").run()
display(paths)
The search may also be limited by edge filters and maximum path lengths.
val filteredPaths = g.bfs.fromExpr("name = 'Esther'").toExpr("age < 32")
  .edgeFilter("relationship != 'friend'")
  .maxPathLength(3)
  .run()
display(filteredPaths)
Connected components
Compute the connected component membership of each vertex and return a graph with each vertex assigned a component ID.
READ https://graphframes.github.io/graphframes/docs/_site/user-guide.html#connected-components.
From https://graphframes.github.io/graphframes/docs/_site/user-guide.html#connected-components:-
NOTE: With GraphFrames 0.3.0 and later releases, the default Connected Components algorithm requires setting a Spark checkpoint directory. Users can revert to the old algorithm using .setAlgorithm("graphx").
Recall the following quote from Chapter 5 on Effective Transformations of the High Performance Spark Book why one needs to check-point to keep the RDD lineage DAGs from growing too large.
Types of Reuse: Cache, Persist, Checkpoint, Shuffle Files If you decide that you need to reuse your RDD, Spark provides a multitude of options for how to store the RDD. Thus it is important to understand when to use the various types of persistence.There are three primary operations that you can use to store your RDD: cache, persist, and checkpoint. In general, caching (equivalent to persisting with the in-memory storage) and persisting are most useful to avoid recomputation during one Spark job or to break RDDs with long lineages, since they keep an RDD on the executors during a Spark job. Checkpointing is most useful to prevent failures and a high cost of recomputation by saving intermediate results. Like persisting, checkpointing helps avoid computation, thus minimizing the cost of failure, and avoids recomputation by breaking the lineage graph.
sc.setCheckpointDir("/_checkpoint") // just a directory in distributed file system
val result = g.connectedComponents.run()
display(result)
| id | name | age | component |
|---|---|---|---|
| a | Alice | 34.0 | 4.12316860416e11 |
| b | Bob | 36.0 | 4.12316860416e11 |
| c | Charlie | 30.0 | 4.12316860416e11 |
| d | David | 29.0 | 4.12316860416e11 |
| e | Esther | 32.0 | 4.12316860416e11 |
| f | Fanny | 36.0 | 4.12316860416e11 |
| g | Gabby | 60.0 | 1.46028888064e11 |
Fun Exercise: Try to modify the d3.graph function to allow a visualisation of a given Sequence of component ids in the above result.
Strongly connected components
Compute the strongly connected component (SCC) of each vertex and return a graph with each vertex assigned to the SCC containing that vertex.
READ https://graphframes.github.io/graphframes/docs/_site/user-guide.html#strongly-connected-components.
val result = g.stronglyConnectedComponents.maxIter(10).run()
display(result.orderBy("component"))
| id | name | age | component |
|---|---|---|---|
| g | Gabby | 60.0 | 1.46028888064e11 |
| f | Fanny | 36.0 | 4.12316860416e11 |
| a | Alice | 34.0 | 6.70014898176e11 |
| e | Esther | 32.0 | 6.70014898176e11 |
| d | David | 29.0 | 6.70014898176e11 |
| b | Bob | 36.0 | 1.047972020224e12 |
| c | Charlie | 30.0 | 1.047972020224e12 |
Label propagation
Run static Label Propagation Algorithm for detecting communities in networks.
Each node in the network is initially assigned to its own community. At every superstep, nodes send their community affiliation to all neighbors and update their state to the mode community affiliation of incoming messages.
LPA is a standard community detection algorithm for graphs. It is very inexpensive computationally, although
- (1) convergence is not guaranteed and
- (2) one can end up with trivial solutions (all nodes are identified into a single community).
READ: https://graphframes.github.io/graphframes/docs/_site/user-guide.html#label-propagation-algorithm-lpa.
val result = g.labelPropagation.maxIter(5).run()
display(result.orderBy("label"))
| id | name | age | label |
|---|---|---|---|
| g | Gabby | 60.0 | 1.46028888064e11 |
| b | Bob | 36.0 | 1.047972020224e12 |
| e | Esther | 32.0 | 1.382979469312e12 |
| a | Alice | 34.0 | 1.382979469312e12 |
| c | Charlie | 30.0 | 1.382979469312e12 |
| f | Fanny | 36.0 | 1.46028888064e12 |
| d | David | 29.0 | 1.46028888064e12 |
PageRank
Identify important vertices in a graph based on connections.
READ: https://graphframes.github.io/graphframes/docs/_site/user-guide.html#pagerank.
// Run PageRank until convergence to tolerance "tol".
val results = g.pageRank.resetProbability(0.15).tol(0.01).run()
display(results.vertices)
| id | name | age | pagerank |
|---|---|---|---|
| b | Bob | 36.0 | 2.655507832863289 |
| e | Esther | 32.0 | 0.37085233187676075 |
| a | Alice | 34.0 | 0.44910633706538744 |
| f | Fanny | 36.0 | 0.3283606792049851 |
| g | Gabby | 60.0 | 0.1799821386239711 |
| d | David | 29.0 | 0.3283606792049851 |
| c | Charlie | 30.0 | 2.6878300011606218 |
display(results.edges)
| src | dst | relationship | weight |
|---|---|---|---|
| f | c | follow | 1.0 |
| e | f | follow | 0.5 |
| e | d | friend | 0.5 |
| d | a | friend | 1.0 |
| c | b | follow | 1.0 |
| b | c | follow | 1.0 |
| a | e | friend | 0.5 |
| a | b | friend | 0.5 |
// Run PageRank for a fixed number of iterations.
val results2 = g.pageRank.resetProbability(0.15).maxIter(10).run()
display(results2.vertices)
| id | name | age | pagerank |
|---|---|---|---|
| b | Bob | 36.0 | 2.7025217677349773 |
| e | Esther | 32.0 | 0.3613490987992571 |
| a | Alice | 34.0 | 0.4485115093698443 |
| f | Fanny | 36.0 | 0.32504910549694244 |
| g | Gabby | 60.0 | 0.17073170731707318 |
| d | David | 29.0 | 0.32504910549694244 |
| c | Charlie | 30.0 | 2.6667877057849627 |
// Run PageRank personalized for vertex "a"
val results3 = g.pageRank.resetProbability(0.15).maxIter(10).sourceId("a").run()
display(results3.vertices)
| id | name | age | pagerank |
|---|---|---|---|
| b | Bob | 36.0 | 0.3366143039702568 |
| e | Esther | 32.0 | 7.657840357273027e-2 |
| a | Alice | 34.0 | 0.17710831642683564 |
| f | Fanny | 36.0 | 3.189213697274781e-2 |
| g | Gabby | 60.0 | 0.0 |
| d | David | 29.0 | 3.189213697274781e-2 |
| c | Charlie | 30.0 | 0.3459147020846817 |
Shortest paths
Computes shortest paths to the given set of landmark vertices, where landmarks are specified by vertex ID.
READ https://graphframes.github.io/graphframes/docs/_site/user-guide.html#shortest-paths.
val paths = g.shortestPaths.landmarks(Seq("a", "d")).run()
display(paths)
g.edges.show()
+---+---+------------+
|src|dst|relationship|
+---+---+------------+
|  a|  b|      friend|
|  b|  c|      follow|
|  c|  b|      follow|
|  f|  c|      follow|
|  e|  f|      follow|
|  e|  d|      friend|
|  d|  a|      friend|
|  a|  e|      friend|
+---+---+------------+
Triangle count
Computes the number of triangles passing through each vertex.
val results = g.triangleCount.run()
display(results)
| count | id | name | age |
|---|---|---|---|
| 1.0 | a | Alice | 34.0 |
| 0.0 | b | Bob | 36.0 |
| 0.0 | c | Charlie | 30.0 |
| 1.0 | d | David | 29.0 |
| 1.0 | e | Esther | 32.0 |
| 0.0 | f | Fanny | 36.0 |
| 0.0 | g | Gabby | 60.0 |
YouTry
and undestand how the below code snippet shows how to use aggregateMessages to compute the sum of the ages of adjacent users.
import org.graphframes.{examples,GraphFrame}
import org.graphframes.lib.AggregateMessages
val g: GraphFrame = examples.Graphs.friends  // get example graph

// We will use AggregateMessages utilities later, so name it "AM" for short.
val AM = AggregateMessages

// For each user, sum the ages of the adjacent users.
val msgToSrc = AM.dst("age")
val msgToDst = AM.src("age")
val agg = { g.aggregateMessages
  .sendToSrc(msgToSrc)  // send destination user's age to source
  .sendToDst(msgToDst)  // send source user's age to destination
  .agg(sum(AM.msg).as("summedAges")) } // sum up ages, stored in AM.msg column
agg.show()
+---+----------+
| id|summedAges|
+---+----------+
|  a|        97|
|  c|       108|
|  e|        99|
|  d|        66|
|  b|        94|
|  f|        62|
+---+----------+

import org.graphframes.{examples, GraphFrame}
import org.graphframes.lib.AggregateMessages
g: org.graphframes.GraphFrame = GraphFrame(v:[id: string, name: string ... 1 more field], e:[src: string, dst: string ... 1 more field])
AM: org.graphframes.lib.AggregateMessages.type = org.graphframes.lib.AggregateMessages$@706833c8
msgToSrc: org.apache.spark.sql.Column = dst[age]
msgToDst: org.apache.spark.sql.Column = src[age]
agg: org.apache.spark.sql.DataFrame = [id: string, summedAges: bigint]
There is a lot more that can be done with aggregate messaging - let's get into belief propogation algorithm for a more complex example!
Belief propogation is a powerful computational framework for Graphical Models.
- let's dive here:
as
This provides a template for building customized BP algorithms for different types of graphical models.
Project Idea
Understand parallel belief propagation using colored fields in the Scala code linked above and also pasted below in one cell (for you to modify if you want to do it in a databricks or jupyter or zeppelin notebook) unless you want to fork and extend the github repo directly with your own example.
Then use it with necessary adaptations to be able to model your favorite interacting particle system. Don't just redo the Ising model done there!
This can be used to gain intuition for various real-world scenarios, including the mathematics in your head:
- Make a graph for contact network of a set of hosts
- A simple model of COVID spreading in an SI or SIS or SIR or other epidemic models
- this can be abstract and simply show your skills in programming, say create a random network
- or be more explicit with some assumptions about the contact process (population sampled, in one or two cities, with some assumptions on contacts during transportation, school, work, etc)
- show that you have a fully scalable simulation model that can theoretically scale to billions of hosts
The project does not have to be a recommendation to Swedish authorities! Just a start in the right direction, for instance.
Some readings that can help here include the following and references therein:
- The Transmission Process: A Combinatorial Stochastic Process for the Evolution of Transmission Trees over Networks, Raazesh Sainudiin and David Welch, Journal of Theoretical Biology, Volume 410, Pages 137–170, 10.1016/j.jtbi.2016.07.038, 2016.
Other Project Ideas
- try to do a scalable inference algorithm for one of the graphical models that you already know...
- make a large simulaiton of your favourite Finite Markov Information Exchange (FMIE) process defined by Aldous (see reference in the above linked paper)
- anything else that fancies you or your research orientation/interests and can benefit from adapting the template for the parallel belief propagation algorithm here.
If you want to do this project in databricks (or other) notebook then start by modifying the following code from the example and making it run... Then adapt... start in small steps... make a team with fellow students with complementary skills...
/*
 * Licensed to the Apache Software Foundation (ASF) under one or more
 * contributor license agreements.  See the NOTICE file distributed with
 * this work for additional information regarding copyright ownership.
 * The ASF licenses this file to You under the Apache License, Version 2.0
 * (the "License"); you may not use this file except in compliance with
 * the License.  You may obtain a copy of the License at
 *
 *    http://www.apache.org/licenses/LICENSE-2.0
 *
 * Unless required by applicable law or agreed to in writing, software
 * distributed under the License is distributed on an "AS IS" BASIS,
 * WITHOUT WARRANTIES OR CONDITIONS OF ANY KIND, either express or implied.
 * See the License for the specific language governing permissions and
 * limitations under the License.
 */

package org.graphframes.examples

import org.apache.spark.{SparkConf, SparkContext}
import org.apache.spark.graphx.{Graph, VertexRDD, Edge => GXEdge}
import org.apache.spark.sql.{Column, Row, SparkSession, SQLContext}
import org.apache.spark.sql.functions.{col, lit, sum, udf, when}

import org.graphframes.GraphFrame
import org.graphframes.examples.Graphs.gridIsingModel
import org.graphframes.lib.AggregateMessages


/**
 * Example code for Belief Propagation (BP)
 *
 * This provides a template for building customized BP algorithms for different types of
 * graphical models.
 *
 * This example:
 *  - Ising model on a grid
 *  - Parallel Belief Propagation using colored fields
 *
 * Ising models are probabilistic graphical models over binary variables x,,i,,.
 * Each binary variable x,,i,, corresponds to one vertex, and it may take values -1 or +1.
 * The probability distribution P(X) (over all x,,i,,) is parameterized by vertex factors a,,i,,
 * and edge factors b,,ij,,:
 * {{{
 *  P(X) = (1/Z) * exp[ \sum_i a_i x_i + \sum_{ij} b_{ij} x_i x_j ]
 * }}}
 * where Z is the normalization constant (partition function).
 * See [[https://en.wikipedia.org/wiki/Ising_model Wikipedia]] for more information on Ising models.
 *
 * Belief Propagation (BP) provides marginal probabilities of the values of the variables x,,i,,,
 * i.e., P(x,,i,,) for each i.  This allows a user to understand likely values of variables.
 * See [[https://en.wikipedia.org/wiki/Belief_propagation Wikipedia]] for more information on BP.
 *
 * We use a batch synchronous BP algorithm, where batches of vertices are updated synchronously.
 * We follow the mean field update algorithm in Slide 13 of the
 * [[http://www.eecs.berkeley.edu/~wainwrig/Talks/A_GraphModel_Tutorial  talk slides]] from:
 *  Wainwright. "Graphical models, message-passing algorithms, and convex optimization."
 *
 * The batches are chosen according to a coloring.  For background on graph colorings for inference,
 * see for example:
 *  Gonzalez et al. "Parallel Gibbs Sampling: From Colored Fields to Thin Junction Trees."
 *  AISTATS, 2011.
 *
 * The BP algorithm works by:
 *  - Coloring the graph by assigning a color to each vertex such that no neighboring vertices
 *    share the same color.
 *  - In each step of BP, update all vertices of a single color.  Alternate colors.
 */
object BeliefPropagation {

  def main(args: Array[String]): Unit = {
    val spark = SparkSession
      .builder()
      .appName("BeliefPropagation example")
      .getOrCreate()

    val sql = spark.sqlContext

    // Create graphical model g of size 3 x 3.
    val g = gridIsingModel(sql, 3)

    println("Original Ising model:")
    g.vertices.show()
    g.edges.show()

    // Run BP for 5 iterations.
    val numIter = 5
    val results = runBPwithGraphX(g, numIter)

    // Display beliefs.
    val beliefs = results.vertices.select("id", "belief")
    println(s"Done with BP. Final beliefs after $numIter iterations:")
    beliefs.show()

    spark.stop()
  }

  /**
   * Given a GraphFrame, choose colors for each vertex.  No neighboring vertices will share the
   * same color.  The number of colors is minimized.
   *
   * This is written specifically for grid graphs. For non-grid graphs, it should be generalized,
   * such as by using a greedy coloring scheme.
   *
   * @param g  Grid graph generated by [[org.graphframes.examples.Graphs.gridIsingModel()]]
   * @return  Same graph, but with a new vertex column "color" of type Int (0 or 1)
   */
  private def colorGraph(g: GraphFrame): GraphFrame = {
    val colorUDF = udf { (i: Int, j: Int) => (i + j) % 2 }
    val v = g.vertices.withColumn("color", colorUDF(col("i"), col("j")))
    GraphFrame(v, g.edges)
  }

  /**
   * Run Belief Propagation.
   *
   * This implementation of BP shows how to use GraphX's aggregateMessages method.
   * It is simple to convert to and from GraphX format.  This method does the following:
   *  - Color GraphFrame vertices for BP scheduling.
   *  - Convert GraphFrame to GraphX format.
   *  - Run BP using GraphX's aggregateMessages API.
   *  - Augment the original GraphFrame with the BP results (vertex beliefs).
   *
   * @param g  Graphical model created by `org.graphframes.examples.Graphs.gridIsingModel()`
   * @param numIter  Number of iterations of BP to run.  One iteration includes updating each
   *                 vertex's belief once.
   * @return  Same graphical model, but with [[GraphFrame.vertices]] augmented with a new column
   *          "belief" containing P(x,,i,, = +1), the marginal probability of vertex i taking
   *          value +1 instead of -1.
   */
  def runBPwithGraphX(g: GraphFrame, numIter: Int): GraphFrame = {
    // Choose colors for vertices for BP scheduling.
    val colorG = colorGraph(g)
    val numColors: Int = colorG.vertices.select("color").distinct.count().toInt

    // Convert GraphFrame to GraphX, and initialize beliefs.
    val gx0 = colorG.toGraphX
    // Schema maps for extracting attributes
    val vColsMap = colorG.vertexColumnMap
    val eColsMap = colorG.edgeColumnMap
    // Convert vertex attributes to nice case classes.
    val gx1: Graph[VertexAttr, Row] = gx0.mapVertices { case (_, attr) =>
      // Initialize belief at 0.0
      VertexAttr(attr.getDouble(vColsMap("a")), 0.0, attr.getInt(vColsMap("color")))
    }
    // Convert edge attributes to nice case classes.
    val extractEdgeAttr: (GXEdge[Row] => EdgeAttr) = { e =>
      EdgeAttr(e.attr.getDouble(eColsMap("b")))
    }
    var gx: Graph[VertexAttr, EdgeAttr] = gx1.mapEdges(extractEdgeAttr)

    // Run BP for numIter iterations.
    for (iter <- Range(0, numIter)) {
      // For each color, have that color receive messages from neighbors.
      for (color <- Range(0, numColors)) {
        // Send messages to vertices of the current color.
        val msgs: VertexRDD[Double] = gx.aggregateMessages(
          ctx =>
            // Can send to source or destination since edges are treated as undirected.
            if (ctx.dstAttr.color == color) {
              val msg = ctx.attr.b * ctx.srcAttr.belief
              // Only send message if non-zero.
              if (msg != 0) ctx.sendToDst(msg)
            } else if (ctx.srcAttr.color == color) {
              val msg = ctx.attr.b * ctx.dstAttr.belief
              // Only send message if non-zero.
              if (msg != 0) ctx.sendToSrc(msg)
            },
          _ + _)
        // Receive messages, and update beliefs for vertices of the current color.
        gx = gx.outerJoinVertices(msgs) {
          case (vID, vAttr, optMsg) =>
            if (vAttr.color == color) {
              val x = vAttr.a + optMsg.getOrElse(0.0)
              val newBelief = math.exp(-log1pExp(-x))
              VertexAttr(vAttr.a, newBelief, color)
            } else {
              vAttr
            }
        }
      }
    }

    // Convert back to GraphFrame with a new column "belief" for vertices DataFrame.
    val gxFinal: Graph[Double, Unit] = gx.mapVertices((_, attr) => attr.belief).mapEdges(_ => ())
    GraphFrame.fromGraphX(colorG, gxFinal, vertexNames = Seq("belief"))
  }

  case class VertexAttr(a: Double, belief: Double, color: Int)

  case class EdgeAttr(b: Double)

  /**
   * Run Belief Propagation.
   *
   * This implementation of BP shows how to use GraphFrame's aggregateMessages method.
   *  - Color GraphFrame vertices for BP scheduling.
   *  - Run BP using GraphFrame's aggregateMessages API.
   *  - Augment the original GraphFrame with the BP results (vertex beliefs).
   *
   * @param g  Graphical model created by `org.graphframes.examples.Graphs.gridIsingModel()`
   * @param numIter  Number of iterations of BP to run.  One iteration includes updating each
   *                 vertex's belief once.
   * @return  Same graphical model, but with [[GraphFrame.vertices]] augmented with a new column
   *          "belief" containing P(x,,i,, = +1), the marginal probability of vertex i taking
   *          value +1 instead of -1.
   */
  def runBPwithGraphFrames(g: GraphFrame, numIter: Int): GraphFrame = {
    // Choose colors for vertices for BP scheduling.
    val colorG = colorGraph(g)
    val numColors: Int = colorG.vertices.select("color").distinct.count().toInt

    // TODO: Handle vertices without any edges.

    // Initialize vertex beliefs at 0.0.
    var gx = GraphFrame(colorG.vertices.withColumn("belief", lit(0.0)), colorG.edges)

    // Run BP for numIter iterations.
    for (iter <- Range(0, numIter)) {
      // For each color, have that color receive messages from neighbors.
      for (color <- Range(0, numColors)) {
        // Define "AM" for shorthand for referring to the src, dst, edge, and msg fields.
        // (See usage below.)
        val AM = AggregateMessages
        // Send messages to vertices of the current color.
        // We may send to source or destination since edges are treated as undirected.
        val msgForSrc: Column = when(AM.src("color") === color, AM.edge("b") * AM.dst("belief"))
        val msgForDst: Column = when(AM.dst("color") === color, AM.edge("b") * AM.src("belief"))
        val logistic = udf { (x: Double) => math.exp(-log1pExp(-x)) }
        val aggregates = gx.aggregateMessages
          .sendToSrc(msgForSrc)
          .sendToDst(msgForDst)
          .agg(sum(AM.msg).as("aggMess"))
        val v = gx.vertices
        // Receive messages, and update beliefs for vertices of the current color.
        val newBeliefCol = when(v("color") === color && aggregates("aggMess").isNotNull,
          logistic(aggregates("aggMess") + v("a")))
          .otherwise(v("belief"))  // keep old beliefs for other colors
        val newVertices = v
          .join(aggregates, v("id") === aggregates("id"), "left_outer")  // join messages, vertices
          .drop(aggregates("id"))  // drop duplicate ID column (from outer join)
          .withColumn("newBelief", newBeliefCol)  // compute new beliefs
          .drop("aggMess")  // drop messages
          .drop("belief")  // drop old beliefs
          .withColumnRenamed("newBelief", "belief")
        // Cache new vertices using workaround for SPARK-13346
        val cachedNewVertices = AM.getCachedDataFrame(newVertices)
        gx = GraphFrame(cachedNewVertices, gx.edges)
      }
    }

    // Drop the "color" column from vertices
    GraphFrame(gx.vertices.drop("color"), gx.edges)
  }

  /** More numerically stable `log(1 + exp(x))` */
  private def log1pExp(x: Double): Double = {
    if (x > 0) {
      x + math.log1p(math.exp(-x))
    } else {
      math.log1p(math.exp(x))
    }
  }
}