Detecting Persons of Interest to OIL/GAS Price Trends
Johannes Graner (LinkedIn), Albert Nilsson (LinkedIn) and Raazesh Sainudiin (LinkedIn)
2020, Uppsala, Sweden
This project was supported by Combient Mix AB through summer internships at:
Combient Competence Centre for Data Engineering Sciences, Department of Mathematics, Uppsala University, Uppsala, Sweden
Here we will build a pipeline to investigate possible persons, organisations and other entities related to oil and gas that are reported in mass media around the world and their possible co-occurrence with certain trends and trend-reversals in oil price.
Steps:
- Step 0. Setting up and loading GDELT delta.io tables
- Step 1. Create a graph of persons related to gas and oil
- Step 2. Extract communties
- Step 3. Find key Influencers
- Step 4. Visualisation
Resources:
This builds on the following libraries and its antecedents therein:
This work was inspired by:
- Antoine Aamennd's texata-2017
- Andrew Morgan's Trend Calculus Library
import spark.implicits._
import io.delta.tables._
import com.aamend.spark.gdelt._
import org.apache.spark.sql.{Dataset,DataFrame,SaveMode}
import org.apache.spark.sql.functions._
import org.apache.spark.sql.expressions._
import org.graphframes.GraphFrame
import org.apache.spark.sql.SparkSession
"./000b_gdelt_utils"
val rootPath = GdeltUtils.getGdeltV1Path
val rootCheckpointPath = GdeltUtils.getPOICheckpointPath
val gkgPath = rootPath+"gkg"
defined object GdeltUtils
val gkg_v1 = spark.read.format("delta").load(gkgPath).as[GKGEventV1]
val gkg_v1_filt = gkg_v1.filter($"publishDate">"2013-04-01 00:00:00" && $"publishDate"<"2019-12-31 00:00:00")

val oil_gas_themeGKG = gkg_v1_filt.filter(c =>c.themes.contains("ENV_GAS") || c.themes.contains("ENV_OIL"))
The first step is to create a graph between people releated to gas and oil where the edges are number of articles that they are mentioned in together.
Create the GraphFrame of Interest
val edges = oil_gas_themeGKG.select($"persons",$"numArticles")
                          .withColumn("src",explode($"persons"))
                          .withColumn("dst",explode($"persons"))
                          .filter($"src".notEqual($"dst") && $"src" =!= "" && $"dst" =!= "")
                          .groupBy($"src",$"dst")
                          .agg(sum("numArticles").as("count"))
                          .toDF()

val vertices = oil_gas_themeGKG.select($"persons",$"numArticles")
                          .withColumn("id",explode($"persons"))
                          .filter($"id" =!= "")
                          .drop($"persons")
                          .groupBy($"id")
                          .agg(sum("numArticles").as("numArticles"))
                          .toDF()
val pers_graph = GraphFrame(vertices,edges)
Count how many vertices and edges there is in our graph
println("vertex count: " +pers_graph.vertices.count())
println("edge count: " + pers_graph.edges.count())
vertex count: 3422103
edge count: 133703116
val fil_pers_graph = pers_graph.filterEdges($"count" >10).dropIsolatedVertices()
Count how many vertices and edges are in our graph after being filtered
println("filtered vertex count: " +fil_pers_graph.vertices.count())
println("filtered edge count: " + fil_pers_graph.edges.count())
filtered vertex count: 214514
filtered edge count: 4525828
sc.setCheckpointDir(rootCheckpointPath)
Compute the connected components
val comp_vertices = fil_pers_graph.connectedComponents.run()
Checkpoint
comp_vertices.write.parquet(rootCheckpointPath+"comp_vertices")
val comp_vertices = spark.read.parquet(rootCheckpointPath+"comp_vertices")
val comp_graph = GraphFrame(comp_vertices,fil_pers_graph.edges)
Note that almost all edges and vertices are in the connected component labelled 0, our giant component.
comp_graph.vertices.groupBy($"component").agg(count("component").as("count")).orderBy(desc("count")).show()
+------------+------+
|   component| count|
+------------+------+
|           0|195316|
|  8589935254|    97|
| 34359738385|    23|
|        1084|    22|
|         150|    21|
| 94489280677|    20|
| 94489280553|    19|
| 60129543033|    19|
|395136991484|    19|
|180388626903|    17|
|146028888838|    17|
| 25769804801|    16|
| 17179869819|    16|
|231928234487|    16|
|146028888649|    15|
| 51539608679|    15|
| 51539607916|    15|
| 60129543026|    15|
| 42949673514|    15|
|  8589935379|    15|
+------------+------+
only showing top 20 rows
Filter out the graph to only focus on the giant component
val big_comp_graph = comp_graph.filterVertices($"component" === 0)
big_comp_graph: org.graphframes.GraphFrame = GraphFrame(v:[id: string, numArticles: bigint ... 1 more field], e:[src: string, dst: string ... 1 more field])
Step 2. Extract communities
Next, let us extract communities within the giant component.
There are many algorithms for community structure detection:
We use a simple scalable one via label propagation here.
Apply label propagation to find interesting community structures
val label_vertices = big_comp_graph.labelPropagation.maxIter(10).run()
label_vertices: org.apache.spark.sql.DataFrame = [id: string, numArticles: bigint ... 2 more fields]
Checkpoint
label_vertices.write.parquet(rootCheckpointPath+"label_vertices")
big_comp_graph.edges.write.parquet(rootCheckpointPath+"label_edges")
val label_vertices = spark.read.parquet(rootCheckpointPath+"label_vertices")
val label_edges = spark.read.parquet(rootCheckpointPath+"label_edges")
val label_graph = GraphFrame(label_vertices,label_edges)
Step 3. Find key Influencers
Apply page rank to find the key influencers
val com_rank_graph =label_graph.pageRank.resetProbability(0.15).tol(0.015).run()
com_rank_graph: org.graphframes.GraphFrame = GraphFrame(v:[id: string, numArticles: bigint ... 3 more fields], e:[src: string, dst: string ... 2 more fields])
Checkpoint
com_rank_graph.vertices.write.parquet(rootCheckpointPath+"com_rank_vertices")
com_rank_graph.edges.write.parquet(rootCheckpointPath+"com_rank_edges")
val com_rank_vertices = spark.read.parquet(rootCheckpointPath+"com_rank_vertices")
val com_rank_edges =spark.read.parquet(rootCheckpointPath+"com_rank_edges")
val com_rank_graph = GraphFrame(com_rank_vertices,com_rank_edges)
com_rank_graph.vertices.groupBy($"label").agg(count($"label").as("count")).orderBy(desc("count")).show()
Step 4. Visualisation
Look at the top three communities
val toplabel1 = com_rank_graph.filterVertices($"label" === 1520418423783L)
val toplabel2 = com_rank_graph.filterVertices($"label" === 8589934959L)
val toplabel3 =com_rank_graph.filterVertices($"label" === 1580547965452L)
Filter out the top 100 according to pagerank score
val toplabel1Filt = toplabel1.filterVertices($"pagerank" >=55.47527731815801)
Filter out edges to make the graph more comprehensive
val toplabel1FiltE = toplabel1Filt.filterEdges($"count">2000).dropIsolatedVertices()
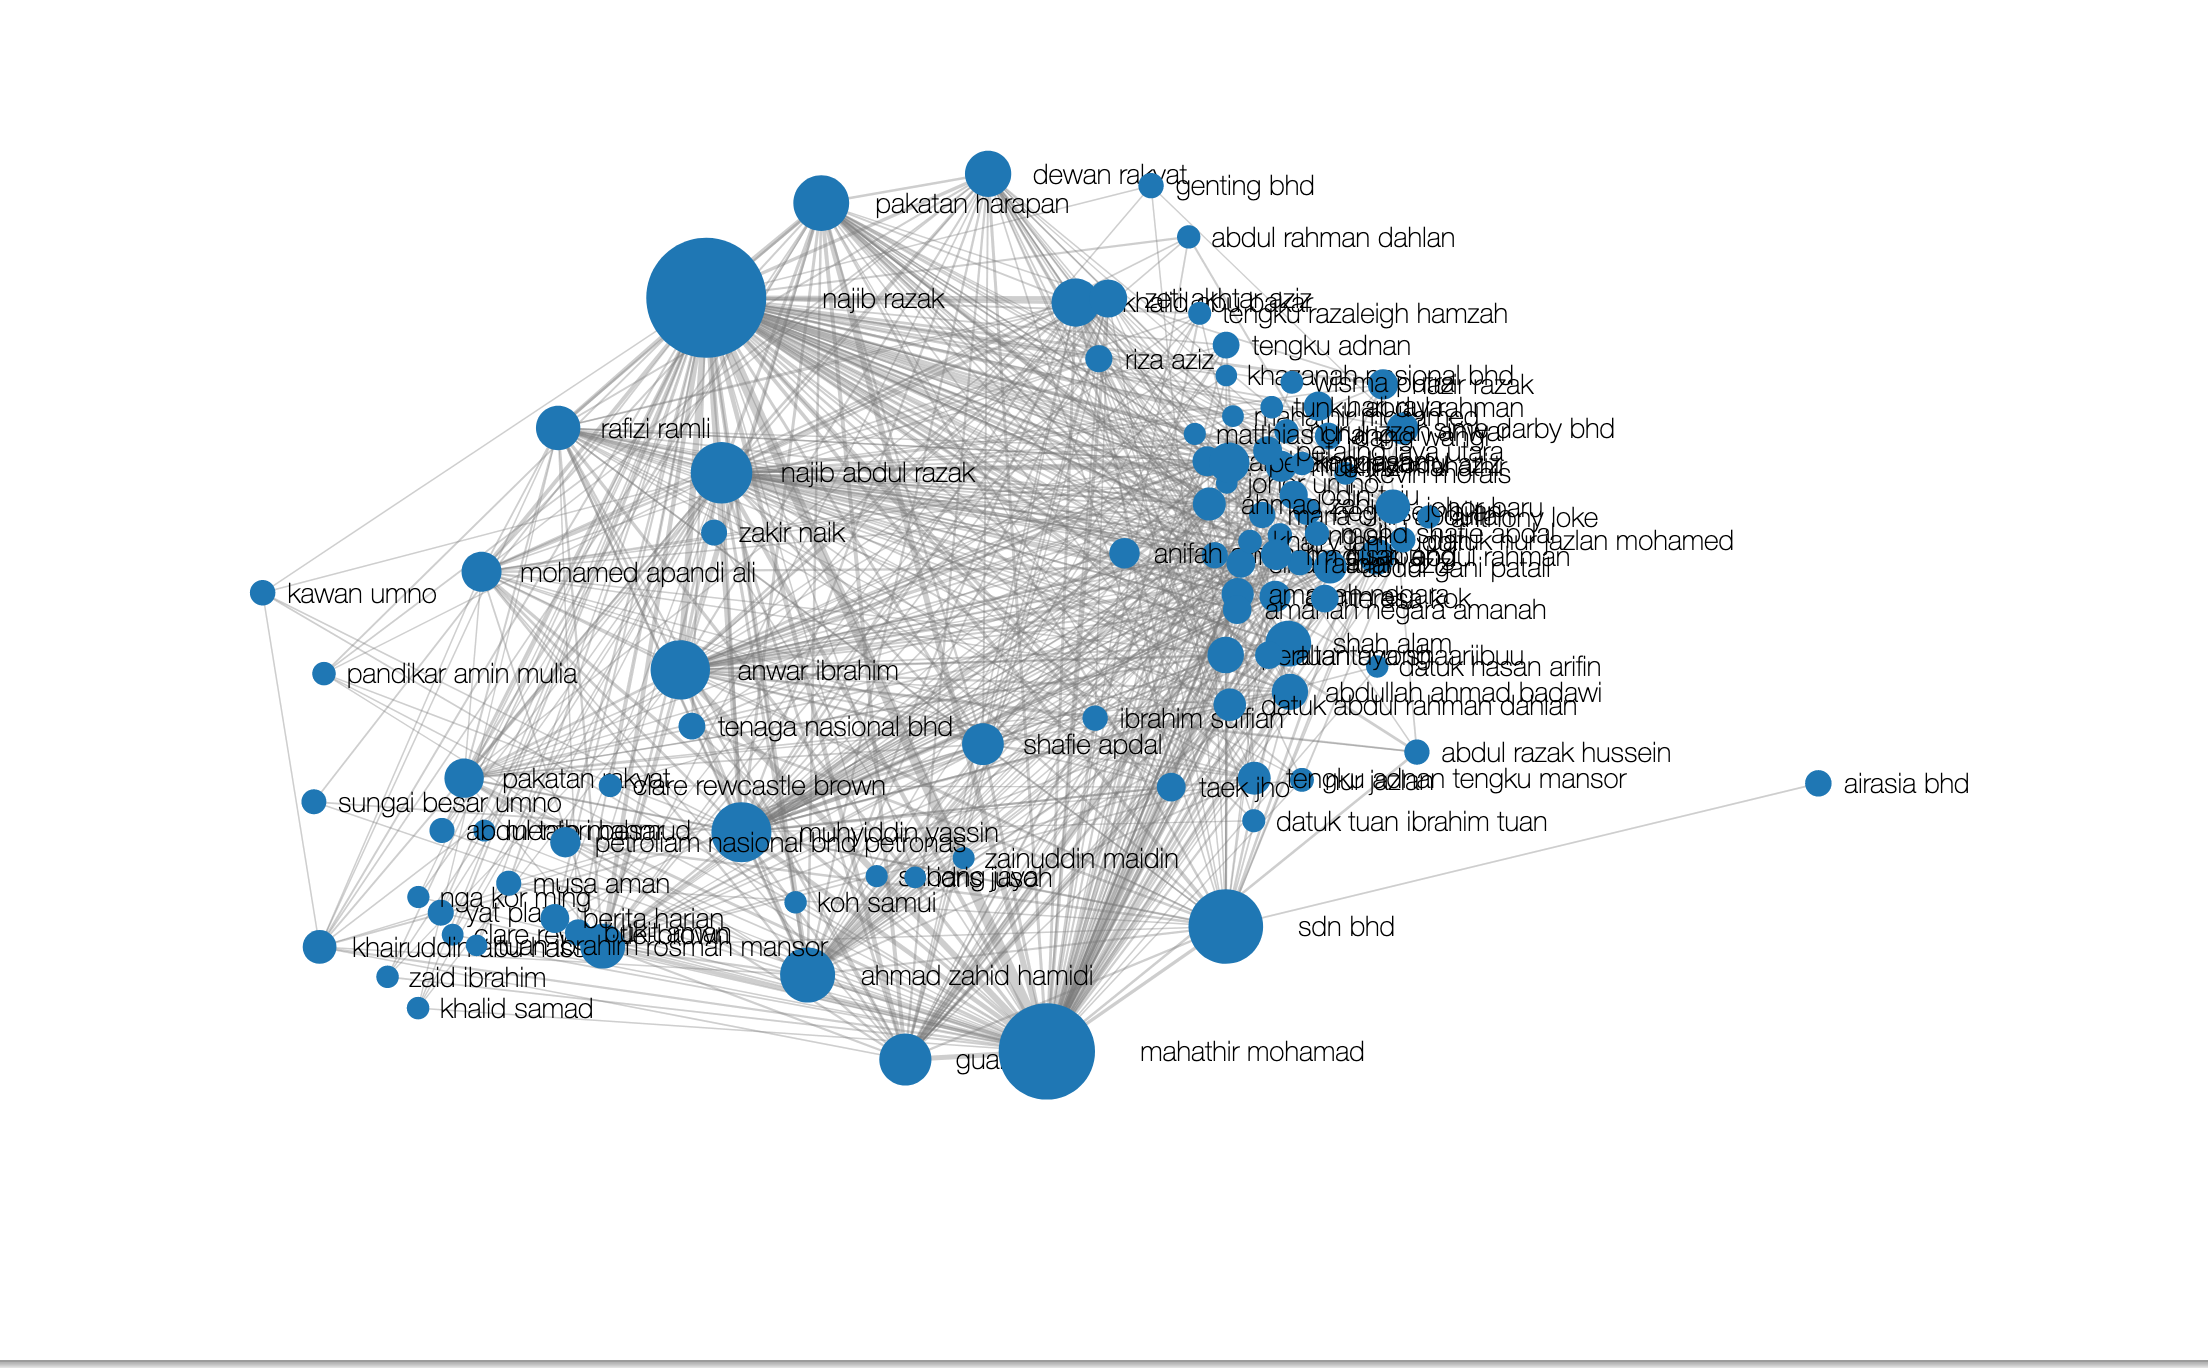
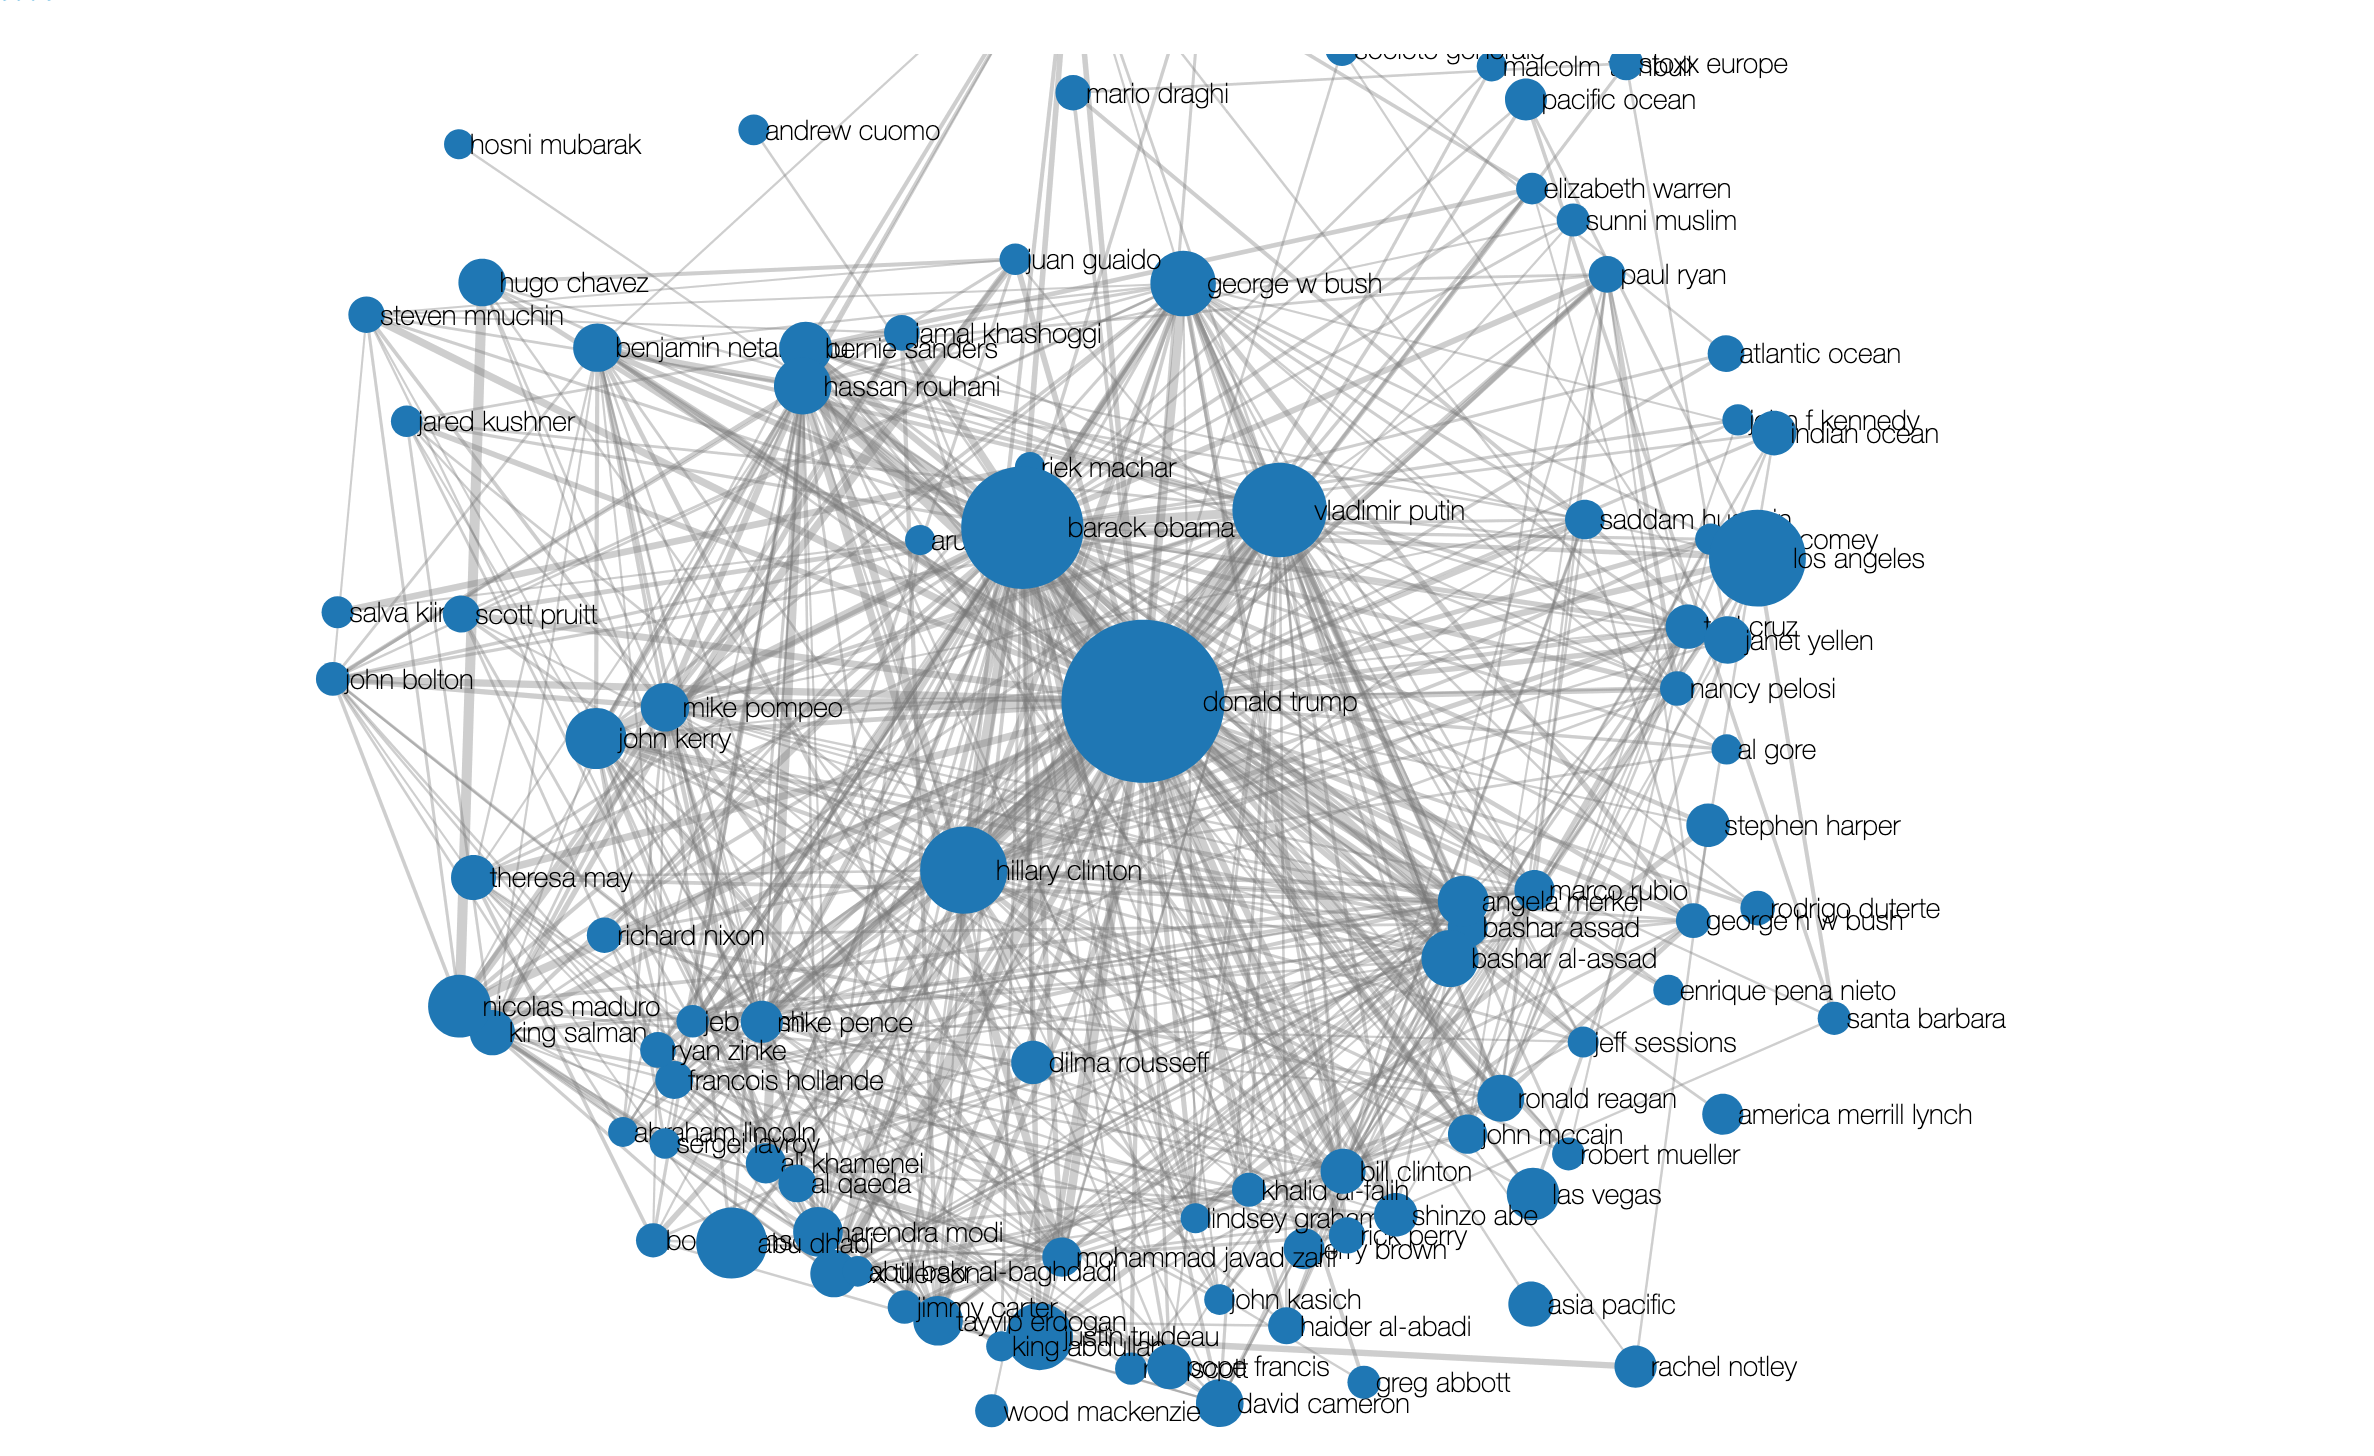
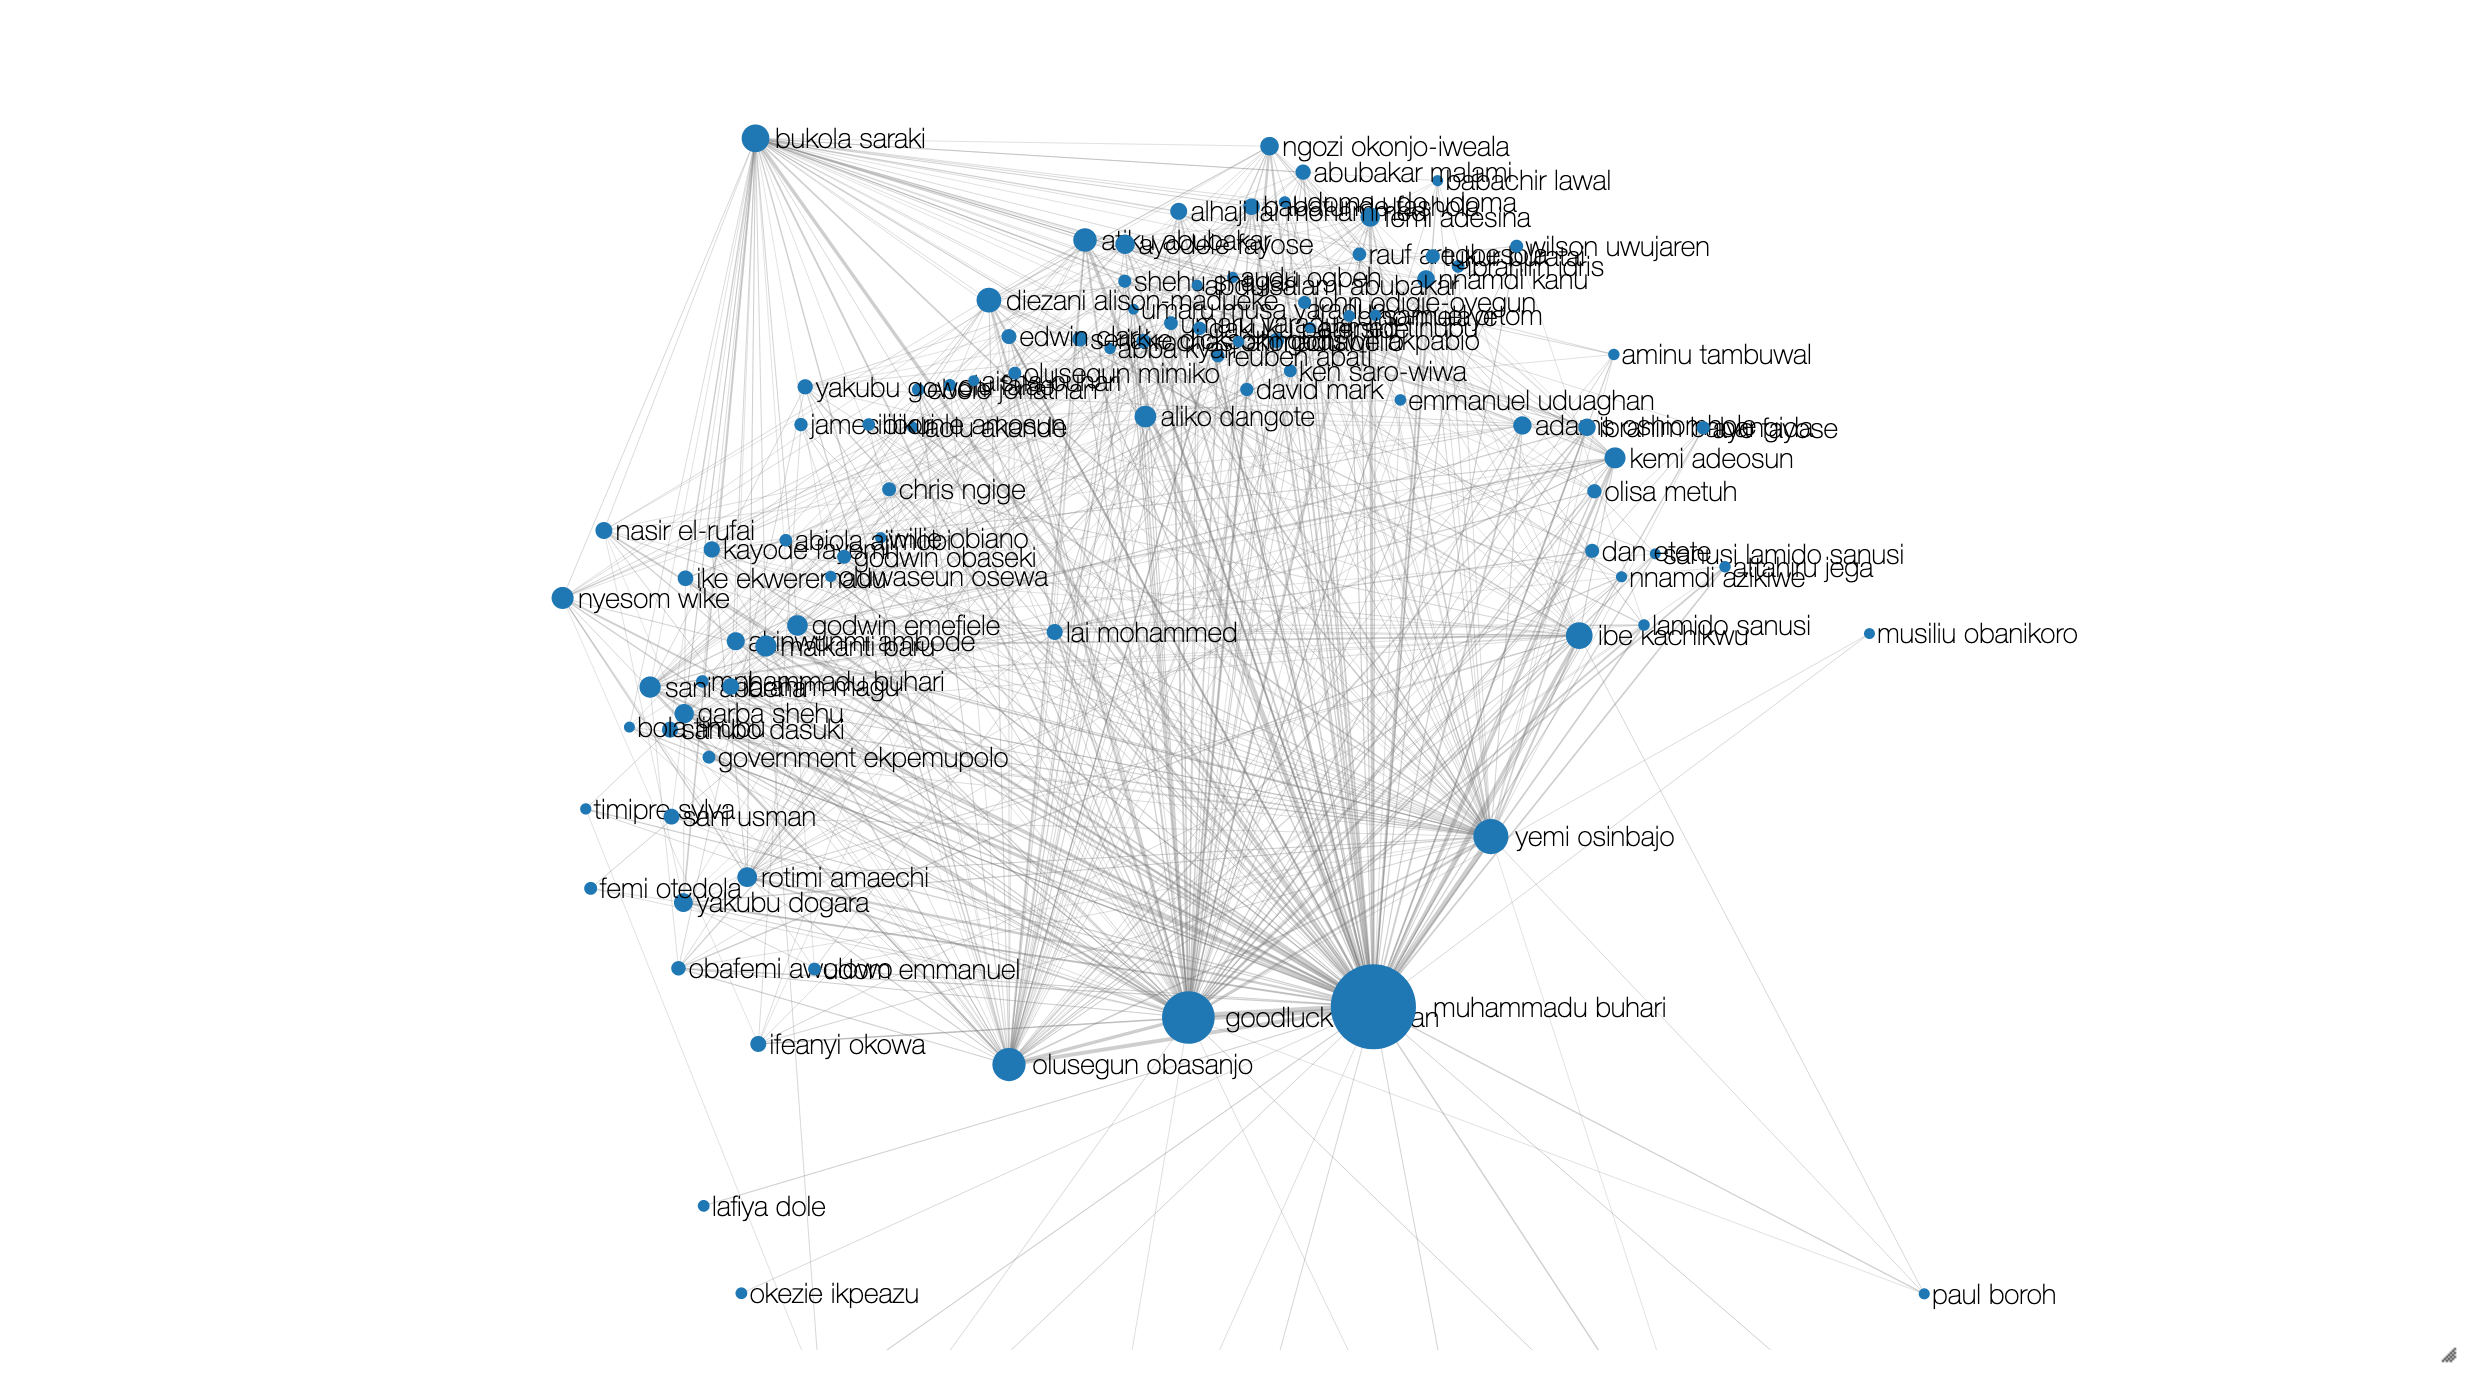
In the interactive d3 graph below, the size of circle correlates with pagerank score.
case class Edge(src: String, dst: String, count: Long)
case class Node(name: String,importance: Double)
case class Link(source: Int, target: Int, value: Long)
case class Graph(nodes: Seq[Node], links: Seq[Link])
object graphs {
val sqlContext = SparkSession.builder().getOrCreate().sqlContext
import sqlContext.implicits._
def force(vertices: Dataset[Node],clicks: Dataset[Edge], height: Int = 100, width: Int = 960): Unit = {
val data = clicks.collect()
val nodes = vertices.collect()
val links = data.map { t =>
Link(nodes.indexWhere(_.name == t.src.replaceAll("_", " ")), nodes.indexWhere(_.name == t.dst.replaceAll("_", " ")), t.count / 20 + 1)
}
showGraph(height, width, Seq(Graph(nodes, links)).toDF().toJSON.first())
}
/**
* Displays a force directed graph using d3
* input: {"nodes": [{"name": "..."}], "links": [{"source": 1, "target": 2, "value": 0}]}
*/
def showGraph(height: Int, width: Int, graph: String): Unit = {
displayHTML(s"""
<style>
.node_circle {
stroke: #777;
stroke-width: 1.3px;
}
.node_label {
pointer-events: none;
}
.link {
stroke: #777;
stroke-opacity: .2;
}
.node_count {
stroke: #777;
stroke-width: 1.0px;
fill: #999;
}
text.legend {
font-family: Verdana;
font-size: 13px;
fill: #000;
}
.node text {
font-family: "Helvetica Neue","Helvetica","Arial",sans-serif;
font-size: function(d) {return (d.importance)+ "px"};
font-weight: 200;
}
</style>
<div id="clicks-graph">
<script src="//d3js.org/d3.v3.min.js"></script>
<script>
var graph = $graph;
var width = $width,
height = $height;
var color = d3.scale.category20();
var force = d3.layout.force()
.charge(-200)
.linkDistance(350)
.size([width, height]);
var svg = d3.select("#clicks-graph").append("svg")
.attr("width", width)
.attr("height", height);
force
.nodes(graph.nodes)
.links(graph.links)
.start();
var link = svg.selectAll(".link")
.data(graph.links)
.enter().append("line")
.attr("class", "link")
.style("stroke-width", function(d) { return Math.sqrt(d.value)/10; });
var node = svg.selectAll(".node")
.data(graph.nodes)
.enter().append("g")
.attr("class", "node")
.call(force.drag);
node.append("circle")
.attr("r", function(d) { return Math.sqrt(d.importance); })
.style("fill", function (d) {
if (d.name.startsWith("other")) { return color(1); } else { return color(2); };
})
node.append("text")
.attr("dx", function(d) { return (Math.sqrt(d.importance)*30)/Math.sqrt(1661.1815574713858); })
.attr("dy", ".35em")
.text(function(d) { return d.name });
//Now we are giving the SVGs co-ordinates - the force layout is generating the co-ordinates which this code is using to update the attributes of the SVG elements
force.on("tick", function () {
link.attr("x1", function (d) {
return d.source.x;
})
.attr("y1", function (d) {
return d.source.y;
})
.attr("x2", function (d) {
return d.target.x;
})
.attr("y2", function (d) {
return d.target.y;
});
d3.selectAll("circle").attr("cx", function (d) {
return d.x;
})
.attr("cy", function (d) {
return d.y;
});
d3.selectAll("text").attr("x", function (d) {
return d.x;
})
.attr("y", function (d) {
return d.y;
});
});
</script>
</div>
""")
}
def help() = {
displayHTML("""
<p>
Produces a force-directed graph given a collection of edges of the following form:</br>
<tt><font color="#a71d5d">case class</font> <font color="#795da3">Edge</font>(<font color="#ed6a43">src</font>: <font color="#a71d5d">String</font>, <font color="#ed6a43">dest</font>: <font color="#a71d5d">String</font>, <font color="#ed6a43">count</font>: <font color="#a71d5d">Long</font>)</tt>
</p>
<p>Usage:<br/>
<tt><font color="#a71d5d">import</font> <font color="#ed6a43">d3._</font></tt><br/>
<tt><font color="#795da3">graphs.force</font>(</br>
<font color="#ed6a43">height</font> = <font color="#795da3">500</font>,<br/>
<font color="#ed6a43">width</font> = <font color="#795da3">500</font>,<br/>
<font color="#ed6a43">clicks</font>: <font color="#795da3">Dataset</font>[<font color="#795da3">Edge</font>])</tt>
</p>""")
}
}
graphs.force(
height = 800,
width = 1200,
clicks = toplabel1FiltE.edges.as[Edge],
vertices = toplabel1FiltE.vertices.select($"id".as("name"),$"pagerank".as("importance")).as[Node]
)
Filter out the top 100 according to pagerank score
val toplabel2Filt = toplabel2.filterVertices($"pagerank" >=7.410990956624706)
Filter out edges to and vertices with small amount of edges to make the graph more comprehensive
val toplabel2FiltE = toplabel2Filt.filterEdges($"count">136).dropIsolatedVertices()
Nigerian cluster
case class Edge(src: String, dst: String, count: Long)
case class Node(name: String,importance: Double)
case class Link(source: Int, target: Int, value: Long)
case class Graph(nodes: Seq[Node], links: Seq[Link])
object graphs {
// val sqlContext = SQLContext.getOrCreate(org.apache.spark.SparkContext.getOrCreate()) /// fix
val sqlContext = SparkSession.builder().getOrCreate().sqlContext
import sqlContext.implicits._
def force(vertices: Dataset[Node],clicks: Dataset[Edge], height: Int = 100, width: Int = 960): Unit = {
val data = clicks.collect()
val nodes = vertices.collect()
val links = data.map { t =>
Link(nodes.indexWhere(_.name == t.src.replaceAll("_", " ")), nodes.indexWhere(_.name == t.dst.replaceAll("_", " ")), t.count / 20 + 1)
}
showGraph(height, width, Seq(Graph(nodes, links)).toDF().toJSON.first())
}
/**
* Displays a force directed graph using d3
* input: {"nodes": [{"name": "..."}], "links": [{"source": 1, "target": 2, "value": 0}]}
*/
def showGraph(height: Int, width: Int, graph: String): Unit = {
displayHTML(s"""
<style>
.node_circle {
stroke: #777;
stroke-width: 1.3px;
}
.node_label {
pointer-events: none;
}
.link {
stroke: #777;
stroke-opacity: .2;
}
.node_count {
stroke: #777;
stroke-width: 1.0px;
fill: #999;
}
text.legend {
font-family: Verdana;
font-size: 13px;
fill: #000;
}
.node text {
font-family: "Helvetica Neue","Helvetica","Arial",sans-serif;
font-size: function(d) {return (d.importance)+ "px"};
font-weight: 200;
}
</style>
<div id="clicks-graph">
<script src="//d3js.org/d3.v3.min.js"></script>
<script>
var graph = $graph;
var width = $width,
height = $height;
var color = d3.scale.category20();
var force = d3.layout.force()
.charge(-200)
.linkDistance(350)
.size([width, height]);
var svg = d3.select("#clicks-graph").append("svg")
.attr("width", width)
.attr("height", height);
force
.nodes(graph.nodes)
.links(graph.links)
.start();
var link = svg.selectAll(".link")
.data(graph.links)
.enter().append("line")
.attr("class", "link")
.style("stroke-width", function(d) { return Math.sqrt(d.value)/10; });
var node = svg.selectAll(".node")
.data(graph.nodes)
.enter().append("g")
.attr("class", "node")
.call(force.drag);
node.append("circle")
.attr("r", function(d) { return Math.sqrt(d.importance); })
.style("fill", function (d) {
if (d.name.startsWith("other")) { return color(1); } else { return color(2); };
})
node.append("text")
.attr("dx", function(d) { return (Math.sqrt(d.importance)*30)/Math.sqrt(453.6031403843406); })
.attr("dy", ".35em")
.text(function(d) { return d.name });
//Now we are giving the SVGs co-ordinates - the force layout is generating the co-ordinates which this code is using to update the attributes of the SVG elements
force.on("tick", function () {
link.attr("x1", function (d) {
return d.source.x;
})
.attr("y1", function (d) {
return d.source.y;
})
.attr("x2", function (d) {
return d.target.x;
})
.attr("y2", function (d) {
return d.target.y;
});
d3.selectAll("circle").attr("cx", function (d) {
return d.x;
})
.attr("cy", function (d) {
return d.y;
});
d3.selectAll("text").attr("x", function (d) {
return d.x;
})
.attr("y", function (d) {
return d.y;
});
});
</script>
</div>
""")
}
def help() = {
displayHTML("""
<p>
Produces a force-directed graph given a collection of edges of the following form:</br>
<tt><font color="#a71d5d">case class</font> <font color="#795da3">Edge</font>(<font color="#ed6a43">src</font>: <font color="#a71d5d">String</font>, <font color="#ed6a43">dest</font>: <font color="#a71d5d">String</font>, <font color="#ed6a43">count</font>: <font color="#a71d5d">Long</font>)</tt>
</p>
<p>Usage:<br/>
<tt><font color="#a71d5d">import</font> <font color="#ed6a43">d3._</font></tt><br/>
<tt><font color="#795da3">graphs.force</font>(</br>
<font color="#ed6a43">height</font> = <font color="#795da3">500</font>,<br/>
<font color="#ed6a43">width</font> = <font color="#795da3">500</font>,<br/>
<font color="#ed6a43">clicks</font>: <font color="#795da3">Dataset</font>[<font color="#795da3">Edge</font>])</tt>
</p>""")
}
}
graphs.force(
height = 800,
width = 1200,
clicks = toplabel2FiltE.edges.as[Edge],
vertices = toplabel2FiltE.vertices.select($"id".as("name"),$"pagerank".as("importance")).as[Node]
)
Filter out the top 100 according to pagerank score
val toplabel3Filt = toplabel3.filterVertices($"pagerank" >=3.160183413696083).filterEdges($"count">4*18).dropIsolatedVertices()
Filter out edges to and vertices with small amount of edges to make the graph more comprehensive
val toplabel3FiltE = toplabel3Filt.filterEdges($"count">50).dropIsolatedVertices()
Malaysian cluster
case class Edge(src: String, dst: String, count: Long)
case class Node(name: String,importance: Double)
case class Link(source: Int, target: Int, value: Long)
case class Graph(nodes: Seq[Node], links: Seq[Link])
object graphs {
// val sqlContext = SQLContext.getOrCreate(org.apache.spark.SparkContext.getOrCreate()) /// fix
val sqlContext = SparkSession.builder().getOrCreate().sqlContext
import sqlContext.implicits._
def force(vertices: Dataset[Node],clicks: Dataset[Edge], height: Int = 100, width: Int = 960): Unit = {
val data = clicks.collect()
val nodes = vertices.collect()
val links = data.map { t =>
Link(nodes.indexWhere(_.name == t.src.replaceAll("_", " ")), nodes.indexWhere(_.name == t.dst.replaceAll("_", " ")), t.count / 20 + 1)
}
showGraph(height, width, Seq(Graph(nodes, links)).toDF().toJSON.first())
}
/**
* Displays a force directed graph using d3
* input: {"nodes": [{"name": "..."}], "links": [{"source": 1, "target": 2, "value": 0}]}
*/
def showGraph(height: Int, width: Int, graph: String): Unit = {
displayHTML(s"""
<style>
.node_circle {
stroke: #777;
stroke-width: 1.3px;
}
.node_label {
pointer-events: none;
}
.link {
stroke: #777;
stroke-opacity: .2;
}
.node_count {
stroke: #777;
stroke-width: 1.0px;
fill: #999;
}
text.legend {
font-family: Verdana;
font-size: 13px;
fill: #000;
}
.node text {
font-family: "Helvetica Neue","Helvetica","Arial",sans-serif;
font-size: function(d) {return (d.importance)+ "px"};
font-weight: 200;
}
</style>
<div id="clicks-graph">
<script src="//d3js.org/d3.v3.min.js"></script>
<script>
var graph = $graph;
var width = $width,
height = $height;
var color = d3.scale.category20();
var force = d3.layout.force()
.charge(-200)
.linkDistance(300)
.size([width, height]);
var svg = d3.select("#clicks-graph").append("svg")
.attr("width", width)
.attr("height", height);
force
.nodes(graph.nodes)
.links(graph.links)
.start();
var link = svg.selectAll(".link")
.data(graph.links)
.enter().append("line")
.attr("class", "link")
.style("stroke-width", function(d) { return Math.sqrt(d.value)/3; });
var node = svg.selectAll(".node")
.data(graph.nodes)
.enter().append("g")
.attr("class", "node")
.call(force.drag);
node.append("circle")
.attr("r", function(d) { return (Math.sqrt(d.importance)*30)/Math.sqrt(98.7695771886648); })
.style("fill", function (d) {
if (d.name.startsWith("other")) { return color(1); } else { return color(2); };
})
node.append("text")
.attr("dx", function(d) { return (Math.sqrt(d.importance)*30)/Math.sqrt(26.343032735543023); })
.attr("dy", ".35em")
.text(function(d) { return d.name });
//Now we are giving the SVGs co-ordinates - the force layout is generating the co-ordinates which this code is using to update the attributes of the SVG elements
force.on("tick", function () {
link.attr("x1", function (d) {
return d.source.x;
})
.attr("y1", function (d) {
return d.source.y;
})
.attr("x2", function (d) {
return d.target.x;
})
.attr("y2", function (d) {
return d.target.y;
});
d3.selectAll("circle").attr("cx", function (d) {
return d.x;
})
.attr("cy", function (d) {
return d.y;
});
d3.selectAll("text").attr("x", function (d) {
return d.x;
})
.attr("y", function (d) {
return d.y;
});
});
</script>
</div>
""")
}
def help() = {
displayHTML("""
<p>
Produces a force-directed graph given a collection of edges of the following form:</br>
<tt><font color="#a71d5d">case class</font> <font color="#795da3">Edge</font>(<font color="#ed6a43">src</font>: <font color="#a71d5d">String</font>, <font color="#ed6a43">dest</font>: <font color="#a71d5d">String</font>, <font color="#ed6a43">count</font>: <font color="#a71d5d">Long</font>)</tt>
</p>
<p>Usage:<br/>
<tt><font color="#a71d5d">import</font> <font color="#ed6a43">d3._</font></tt><br/>
<tt><font color="#795da3">graphs.force</font>(</br>
<font color="#ed6a43">height</font> = <font color="#795da3">500</font>,<br/>
<font color="#ed6a43">width</font> = <font color="#795da3">500</font>,<br/>
<font color="#ed6a43">clicks</font>: <font color="#795da3">Dataset</font>[<font color="#795da3">Edge</font>])</tt>
</p>""")
}
}
graphs.force(
height = 800,
width = 1200,
clicks = toplabel3FiltE.edges.as[Edge],
vertices = toplabel3FiltE.vertices.select($"id".as("name"),$"pagerank".as("importance")).as[Node]
)