Clustering emoticons based on tweets
In this notebook we will look at the symbols in the Unicode block Emoticons, which contains 80 commonly used emojis. The goal is to find out which emoticons are related to each other and hopefully finding clusters that correspond vaguely to some sentiment of an emoticon. We will do this in a fairly naïve way since our focus was on learning streaming, spark and scala. First let's have a look at the emojis in question, they are presented in the table from Wikipedia below.
In the following two cells we create a list of these emoticons and load the previously collected dataset of tweets.
val emoticonsList = List(
  "😀", "😁", "😂",	"😃", "😄",	"😅", "😆",	"😇", "😈",	"😉", "😊",	"😋", "😌", "😍", "😎", "😏",
  "😐",	"😑", "😒",	"😓", "😔", "😕", "😖", "😗", "😘", "😙", "😚", "😛", "😜", "😝", "😞", "😟",
  "😠",	"😡", "😢", "😣", "😤", "😥", "😦", "😧", "😨", "😩", "😪", "😫", "😬", "😭", "😮", "😯",
  "😰",	"😱", "😲", "😳", "😴", "😵", "😶", "😷", "😸", "😹", "😺", "😻", "😼", "😽", "😾", "😿",
  "🙀",	"🙁", "🙂", "🙃", "🙄", "🙅", "🙆", "🙇", "🙈", "🙉", "🙊", "🙋", "🙌", "🙍", "🙎", "🙏"
)

val emoticonsMap = emoticonsList.zipWithIndex.toMap
val nbrEmoticons = emoticonsList.length
val fullDF = sqlContext.read.parquet("/datasets/ScaDaMaLe/twitter/student-project-10_group-Geosmus/{2020,2021,continuous_22_12}/*/*/*/*/*")
println(fullDF.count)
2013137
fullDF: org.apache.spark.sql.DataFrame = [CurrentTweetDate: timestamp, CurrentTwID: bigint ... 7 more fields]
How to cluster emoticons
We could just look at the descriptions and appearances of the various emoticons and cluster them into broad categories based on that. However, instead we will try to use our collected tweet dataset to create a clustering. Then we will use the intuition based on the descriptions and appearances to judge how successful this approach was.
We will use the Jaccard distance between emoticons to try to cluster them. The Jaccard distance between emoticons \(e_1\) and \(e_2\) is given by
\[ d(e_1, e_2) = 1 - \frac{\# (e_1\wedge e_2)}{\# (e_1) + \# (e_2) - \# (e_1\wedge e_2)}, \]
where \(\#(e)\) is the number of tweets collected containing the emoticon \(e\), and \(\# (e_1\wedge e_2)\) is the number of tweets collected containing both \(e_1\) and \(e_2\).
In order to find the Jaccard distances between emoticons, we must create a matrix containing for each pair of emoticons how often they appear together in the dataset of tweets and also in how many tweets each emoticon appears individually. First we define a function to create such a matrix for an individual tweet. Then we will sum these matrices for all the tweets. The matrices will be represented by a 1D array following a certain indexing scheme and containing the entries of the upper triangular part of the matrix (there would be redundancy in finding the whole matrix since it will be symmetric).
def emoticonPairToIndex (a : Int, b : Int) : Int = { // helper function for indexing
  val i = if (a < b) a else b // makes sure j >= i
  val j = if (a < b) b else a
  return i*nbrEmoticons - (i * (i+1))/2 + j
}

def createEmoticonIterator (s : String) : scala.util.matching.Regex.MatchIterator = { // helper function for iterating through the emoticons in a string s
  return s"""[${emoticonsList.mkString}]""".r.findAllIn(s)
}

def createEmoticonMatrix (s : String) : Array[Int] = { // The pair (i, j) will be at location i*(nbrEmoticons - (i+1)/2) + j in this array (this is compatible with later scipy functions)
  var m = Array.fill((nbrEmoticons*nbrEmoticons + nbrEmoticons)/2)(0) // there are 80 emoticons and thus 80^2 / 2 + 80 / 2 emoticon pairs including pairs of the same emoticon
  val emoticonIterator = createEmoticonIterator(s)
  // sets m to 1 for each index corresponding to a pair of emoticons present in the string s (very hacky code...)
  emoticonIterator.zipWithIndex.foreach(em_pair => // iterate over emoticons in s
                                        (createEmoticonIterator(s).drop(em_pair._2)).foreach( // iterate over remaining emoticons in s
                                          second_em =>
                                            (m(emoticonPairToIndex(
                                                emoticonsMap(em_pair._1),
                                                emoticonsMap(second_em))
                                              )
                                            = 1) // set m to 1 for each emoticon pair found in s
                                         )
                                       )
  return m
}
emoticonPairToIndex: (a: Int, b: Int)Int
createEmoticonIterator: (s: String)util.matching.Regex.MatchIterator
createEmoticonMatrix: (s: String)Array[Int]
In the cell below we sum all the "occurence-matrices" and print the diagonal of the summed matrix, i.e. the number of tweets containing each individual emoticon. It is clear that some emoticons are used far more often than others.
val emoticonsMatrix = fullDF.select("CurrentTweet")
                            .filter($"CurrentTweet".rlike(emoticonsList.mkString("|"))) // filters tweets with emoticons
                            .map(row => createEmoticonMatrix(row.mkString)) // creates an "adjacency matrix" for each tweet
                            .reduce((_, _).zipped.map(_ + _)) // sums the matrices elementwise

emoticonsList.zipWithIndex.foreach({case (e, i) => println(e + ", " + Integer.toString(emoticonsMatrix(emoticonPairToIndex(i, i))) + " occurences")})
In the following two cells we create the Jaccard distance matrix which we want to use to cluster the emoticons.
def jaccardDistance (e1 : Int, e2 : Int) : Double = { // specify the emojis in terms of their indices in the list
  return 1.0 - 1.0 * emoticonsMatrix(emoticonPairToIndex(e1, e2)) /
    (emoticonsMatrix(emoticonPairToIndex(e1, e1)) +  emoticonsMatrix(emoticonPairToIndex(e2, e2)) - emoticonsMatrix(emoticonPairToIndex(e1, e2)))
}
jaccardDistance: (e1: Int, e2: Int)Double
var jaccardMatrix = Array.fill(emoticonsMatrix.length)(1.0)
(0 until nbrEmoticons).foreach(i => (i until nbrEmoticons).foreach(j => (jaccardMatrix(emoticonPairToIndex(i, j)) = jaccardDistance(i, j))))
Finally we write the Jaccard distance matrix and the emoticon list to file so that we don't have to keep rerunning the above cells and so that we can load them into python cells next.
//scala.tools.nsc.io.File("/dbfs/datasets/ScaDaMaLe/twitter/student-project-10_group-Geosmus/emoticonsList.txt").writeAll(emoticonsList.mkString("\n"))
//scala.tools.nsc.io.File("/dbfs/datasets/ScaDaMaLe/twitter/student-project-10_group-Geosmus/jMatrix.txt").writeAll(jaccardMatrix.mkString("\n"))
Clustering using python
We now switch to python cells in order to use various clustering methods implemented in SciPy and scikit-learn. First we install and import some packages for later use, then we load the previously saved Jaccard matrix and emoticons list.
%pip install pycountry
Python interpreter will be restarted.
Collecting pycountry
  Downloading pycountry-20.7.3.tar.gz (10.1 MB)
Building wheels for collected packages: pycountry
  Building wheel for pycountry (setup.py): started
  Building wheel for pycountry (setup.py): finished with status 'done'
  Created wheel for pycountry: filename=pycountry-20.7.3-py2.py3-none-any.whl size=10746863 sha256=870cc02de7d6d11499effd59f2b73acdbffc04146079c4a4f9a841ca30f2b587
  Stored in directory: /root/.cache/pip/wheels/57/e8/3f/120ccc1ff7541c108bc5d656e2a14c39da0d824653b62284c6
Successfully built pycountry
Installing collected packages: pycountry
Successfully installed pycountry-20.7.3
Python interpreter will be restarted.
import json
import os
from matplotlib import font_manager as fm, pyplot as plt, rcParams
import numpy as np
import pandas as pd
import pycountry
from scipy.cluster.hierarchy import dendrogram, linkage
from sklearn.manifold import locally_linear_embedding, TSNE
from sklearn.neighbors import NearestNeighbors
jMatrix = np.loadtxt("/dbfs/datasets/ScaDaMaLe/twitter/student-project-10_group-Geosmus/jMatrix.txt")

emoticonsList = []

with open("/dbfs/datasets/ScaDaMaLe/twitter/student-project-10_group-Geosmus/emoticonsList.txt", 'r') as filehandle:
    for line in filehandle:
        e = line.strip() #remove line break
        emoticonsList.append(e)

nbrEmoticons = len(emoticonsList)
print(emoticonsList)
['😀', '😁', '😂', '😃', '😄', '😅', '😆', '😇', '😈', '😉', '😊', '😋', '😌', '😍', '😎', '😏', '😐', '😑', '😒', '😓', '😔', '😕', '😖', '😗', '😘', '😙', '😚', '😛', '😜', '😝', '😞', '😟', '😠', '😡', '😢', '😣', '😤', '😥', '😦', '😧', '😨', '😩', '😪', '😫', '😬', '😭', '😮', '😯', '😰', '😱', '😲', '😳', '😴', '😵', '😶', '😷', '😸', '😹', '😺', '😻', '😼', '😽', '😾', '😿', '🙀', '🙁', '🙂', '🙃', '🙄', '🙅', '🙆', '🙇', '🙈', '🙉', '🙊', '🙋', '🙌', '🙍', '🙎', '🙏']
Some of the SciPy clustering implementations require a full distance matrix, rather than the condensed representation consisting of only the upper triangular part which we have been using thus far. So we create a full matrix in the cell below. In the cell after that we define a helper function for plotting 2D embeddings of emoticons, note that this function loads the unifont-upper font for emoticon rendering, which can be downloaded from http://unifoundry.com/unifont/index.html.
def emoticonPairToIndex(a, b): # same helper function as already defined in scala previously
  i = min(a, b) # makes sure j >= i
  j = max(a, b)
  return i * nbrEmoticons - (i * (i+1))//2 + j

fullDistanceMatrix = np.zeros([nbrEmoticons, nbrEmoticons])
for r in range(nbrEmoticons):
  for c in range(nbrEmoticons):
    fullDistanceMatrix[r, c] = jMatrix[emoticonPairToIndex(r, c)]
def scatterEmojis(emoticonsEmbedded):
  # This function plots a scatter plot of emoticons.
  # emoticonsEmbedded should be an 80x2 array
  # containing 2D coordinates for each of the
  # 80 emoticons in the unicode emoticon block (in the correct order).

  # standardize the embedding for nicer plotting:
  emoticonsEmbedded = emoticonsEmbedded - np.mean(emoticonsEmbedded)
  emoticonsEmbedded = emoticonsEmbedded/np.std(emoticonsEmbedded)

  # for proper emoji rendering change the font
  fpath = os.path.join(rcParams["datapath"], "/dbfs/datasets/ScaDaMaLe/twitter/student-project-10_group-Geosmus/unifont_upper-13.0.05.ttf")
  prop = fm.FontProperties(fname=fpath, size=50)

  fig = plt.figure(figsize=(14, 14))
  for i, label in enumerate(emoticonsList):
      plt.text(emoticonsEmbedded[i, 0], emoticonsEmbedded[i, 1], label, fontproperties=prop)
  plt.setp(plt.gca(), frame_on=False, xticks=(), yticks=())
Locally linear embedding
First off we will look at embedding the emoticons into 2D in ways that respect the Jaccard distances at least to a degree.
Locally linear embedding (LLE) is one such method, which is focused on good presentation of local neighborhoods. You can read more about it in the scikit-learn documentation embedded below.
nbrNeighbors = 8
emoticonsNeighbors = NearestNeighbors(n_neighbors=nbrNeighbors, metric="precomputed").fit(fullDistanceMatrix)
emoticonsEmbedded, err = locally_linear_embedding(emoticonsNeighbors, n_neighbors=nbrNeighbors, n_components=2)
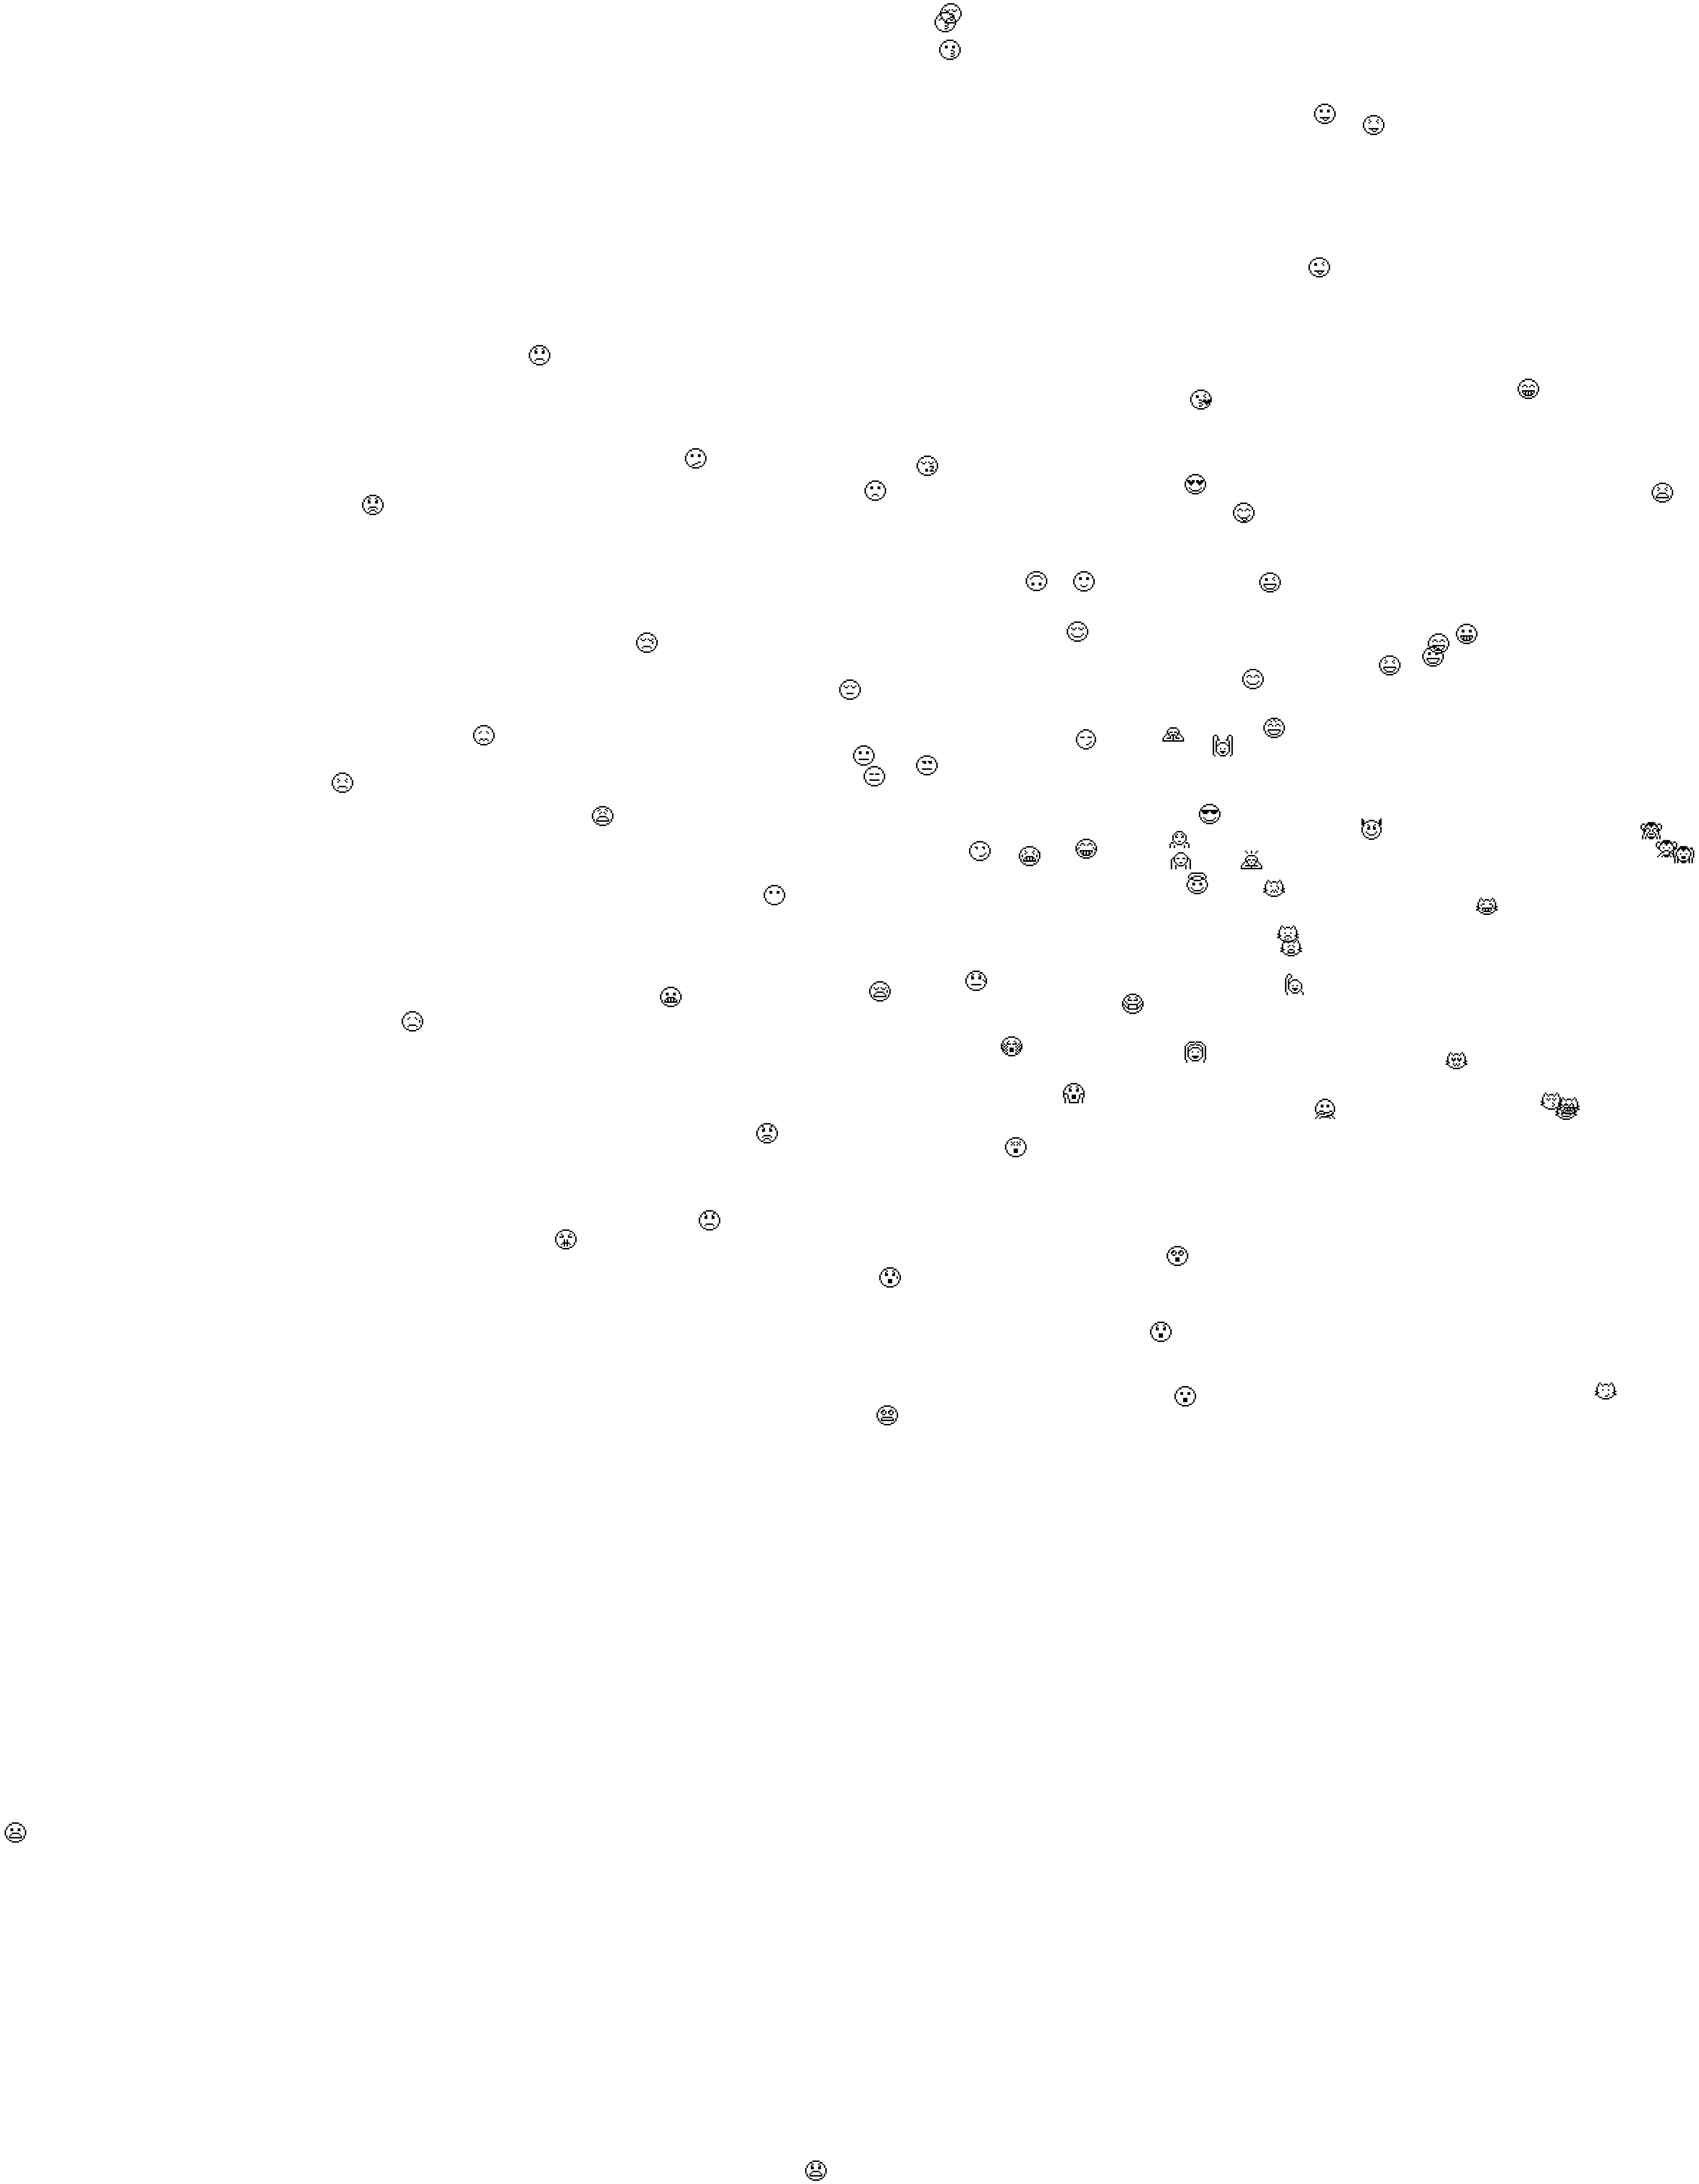
As we can see in the scatter plot below, LLE succeeds in separating the emoticons broadly into happy (down to the left), sad (up) and animal (down to the right) categories. Also some local clusters can be spotted, such as the three emoticons sticking out their tongues, close to the lower left corner.
scatterEmojis(emoticonsEmbedded)

t-distributed Stochastic Neighbor Embedding (t-SNE)
Another approach for embedding the distances into 2D is t-SNE. You can read more about this method in the sk-learn documentation below.
emoticonsEmbedded = TSNE(n_components=2, perplexity=20.0, early_exaggeration=12.0, learning_rate=2.0, n_iter=10000,
                         metric='precomputed', angle=0.01).fit_transform(fullDistanceMatrix)
t-SNE also does a good job at showing a separation between happy and sad emojis but the result is not as convincing as the LLE case. One could spend more time on optimizing the hyperparameters and probably find a better embedding here.
scatterEmojis(emoticonsEmbedded)
Hierarchical clustering
Instead of trying to embed the distances into 2D, we can also create a nice graphical representation in the form of a dendrogram or hierarchical clustering. For this we need to process the distance matrix somewhat again in the following cell.
# remove diagonal from jMatrix, as this is expected by the scipy linkage function:
diagonalIndices = [emoticonPairToIndex(i, i) for i in range(nbrEmoticons)]
jMatrixUpper = jMatrix[[i for i in range((nbrEmoticons**2 + nbrEmoticons)//2) if not i in diagonalIndices]]
assert len(jMatrixUpper) == len(jMatrix) - nbrEmoticons, "the upper matrix should have exactly 80 elements fewer than the upper+diagonal"

# creating a linkage matrix
Z = linkage(jMatrixUpper, 'complete', optimal_ordering=True)
Hierarchical clustering works by starting of with clusters of size one which are just the emoticons and then iteratively joining those clusters which are closest together. The distance between clusters can be defined in various ways, here we somewhat arbitrarily choose so called "complete linkage" which means that the distance between clusters \(a\) and \(b\) is given by the maximum Jaccard distance between some emoticon in \(a\) and some emoticon in \(b\).
We can use dendrograms to neatly represent hirearchical clusterings graphically. The closer two emoticons (or rather emoticon clusters) are to each other, the further down in the dendrogram their branches merge.
The interested WASP PhD student could consider taking the WASP Topological Data Analysis course to learn more about hierarchical clustering.
# plotting a dendrogram
fig = plt.figure(figsize=(40, 8))
dn = dendrogram(Z, labels=emoticonsList, leaf_rotation=0, color_threshold=1.)
ax = plt.gca()

# for proper emoji rendering change the font
fpath = os.path.join(rcParams["datapath"], "/dbfs/datasets/ScaDaMaLe/twitter/student-project-10_group-Geosmus/unifont_upper-13.0.05.ttf")
prop = fm.FontProperties(fname=fpath, size=28)
x_labels = ax.get_xmajorticklabels()
for x in x_labels:
    x.set_fontproperties(prop)

ax.set_ylim([.85, 1.01])

We identify six main clusters in the dendrogram above. From left to right:
- The green "prayer" cluster (🙌🙏😊🙇🙋😷) which also contains the mask emoji and a common smile emoji,
- the teal "happy" cluster (😝😛😜😎😉😏😈😌😋😍😘😇😀😃😄😁😆😅🙂🙃),
- the magenta "cat" cluster (😹😸😽😺😻😿😾🙀😼),
- the yellow "shocked and kisses" or "SK" cluster (😶😬😲😮😯😗😙😚),
- a combined "not happy" cluster consisting of the next black, green, red, teal and magenta clusters (😵😧😦😨😰😱😳😂😭😩😔😢😞😥😓😪😴😫😖😣😟🙁😕😐😑😒🙄😤😡😠),
- finally the yellow "monkey" cluster (🙈🙊🙉).
We proceed with these clusters as they appeal sufficiently to our intuition to seem worthwhile. The observant reader will however have noted some curiosities such as the fact that the "not happy" cluster contains the crying laughing emoji 😂 which is the most popular emoticon in our tweet dataset and which might be used in both happy and not so happy contexts.
Next, we finish the clustering part of this notebook by saving the clusters to file.
monkeyEmoticons = dn["leaves"][76:79]
prayerEmoticons = dn["leaves"][0:6]
shockedAndKissesEmoticons = dn["leaves"][38:46]
happyEmoticons = dn["leaves"][9:29]
notHappyEmoticons = dn["leaves"][46:76]
catEmoticons = dn["leaves"][29:38]
emoticonsDict = {"monkey" : monkeyEmoticons,
                 "prayer" : prayerEmoticons,
                 "SK" : shockedAndKissesEmoticons,
                "happy" : happyEmoticons,
                "notHappy" : notHappyEmoticons,
                "cat" : catEmoticons}
print(emoticonsDict)
{'monkey': [72, 74, 73], 'prayer': [76, 79, 10, 71, 75, 55], 'SK': [54, 44, 50, 46, 47, 23, 25, 26], 'happy': [29, 27, 28, 14, 9, 15, 8, 12, 11, 13, 24, 7, 0, 3, 4, 1, 6, 5, 66, 67], 'notHappy': [53, 39, 38, 40, 48, 49, 51, 2, 45, 41, 20, 34, 30, 37, 19, 42, 52, 43, 22, 35, 31, 65, 21, 16, 17, 18, 68, 36, 33, 32], 'cat': [57, 56, 61, 58, 59, 63, 62, 64, 60]}
#with open('/dbfs/datasets/ScaDaMaLe/twitter/student-project-10_group-Geosmus/emoticonClusters.json', 'w+') as f:
#    json.dump(emoticonsDict, f)
Filtering the tweets by cluster
We return to scala cells to filter the original dataset by what emoticons are present in each tweet. First we load the clusters from the just created json-file.
import org.json4s.jackson.JsonMethods.parse
val jsonString = scala.io.Source.fromFile("/dbfs/datasets/ScaDaMaLe/twitter/student-project-10_group-Geosmus/emoticonClusters.json").mkString
val emoticonClusters = parse(jsonString).values.asInstanceOf[Map[String, List[BigInt]]]
emoticonClusters.foreach({case (key, list) => println(key + ": " + list.map(i => emoticonsList(i.toInt)).mkString)})
prayer: 🙌🙏😊🙇🙋😷
monkey: 🙈🙊🙉
happy: 😝😛😜😎😉😏😈😌😋😍😘😇😀😃😄😁😆😅🙂🙃
SK: 😶😬😲😮😯😗😙😚
cat: 😹😸😽😺😻😿😾🙀😼
notHappy: 😵😧😦😨😰😱😳😂😭😩😔😢😞😥😓😪😴😫😖😣😟🙁😕😐😑😒🙄😤😡😠
import org.json4s.jackson.JsonMethods.parse
jsonString: String = {"monkey": [72, 74, 73], "prayer": [76, 79, 10, 71, 75, 55], "SK": [54, 44, 50, 46, 47, 23, 25, 26], "happy": [29, 27, 28, 14, 9, 15, 8, 12, 11, 13, 24, 7, 0, 3, 4, 1, 6, 5, 66, 67], "notHappy": [53, 39, 38, 40, 48, 49, 51, 2, 45, 41, 20, 34, 30, 37, 19, 42, 52, 43, 22, 35, 31, 65, 21, 16, 17, 18, 68, 36, 33, 32], "cat": [57, 56, 61, 58, 59, 63, 62, 64, 60]}
emoticonClusters: Map[String,List[BigInt]] = Map(prayer -> List(76, 79, 10, 71, 75, 55), monkey -> List(72, 74, 73), happy -> List(29, 27, 28, 14, 9, 15, 8, 12, 11, 13, 24, 7, 0, 3, 4, 1, 6, 5, 66, 67), SK -> List(54, 44, 50, 46, 47, 23, 25, 26), cat -> List(57, 56, 61, 58, 59, 63, 62, 64, 60), notHappy -> List(53, 39, 38, 40, 48, 49, 51, 2, 45, 41, 20, 34, 30, 37, 19, 42, 52, 43, 22, 35, 31, 65, 21, 16, 17, 18, 68, 36, 33, 32))
Next, we create a dataframe emoticonDF with a row for each tweet containing at least one emoticon. We add a column for each cluster indicating if the cluster is represented by some emoticon in the tweet. This dataframe is saved to file to be used in the next notebook 03 which focuses more on data visualization. Here we will finish this notebook by using the databricks display function to plot geopraphic information.
val emoticonDF = fullDF.filter($"CurrentTweet".rlike(emoticonsList.mkString("|"))) // filter tweets with emoticons
                       .select(($"countryCode" :: // select the countryCode column
                                $"CurrentTweetDate" :: // and the timestamp
                                (for {(name, cluster) <- emoticonClusters.toList} yield  // also create a new column for each emoticon cluster indicating if the tweet contains an emoticon of that cluster
                                 $"CurrentTweet".rlike(cluster.map(i => emoticonsList(i.toInt)).mkString("|"))
                                                .alias(name))) // rename new column
                                                : _*) // expand list

emoticonDF.show(3)
+-----------+-------------------+------+------+-----+-----+-----+--------+
|countryCode|   CurrentTweetDate|prayer|monkey|happy|   SK|  cat|notHappy|
+-----------+-------------------+------+------+-----+-----+-----+--------+
|         EG|2020-12-31 15:59:54| false| false|false|false|false|    true|
|         SA|2020-12-31 15:59:54|  true| false|false|false|false|   false|
|         DO|2020-12-31 15:59:54| false| false| true|false|false|   false|
+-----------+-------------------+------+------+-----+-----+-----+--------+
only showing top 3 rows

emoticonDF: org.apache.spark.sql.DataFrame = [countryCode: string, CurrentTweetDate: timestamp ... 6 more fields]
// save to file
// emoticonDF.write.format("parquet").mode("overwrite").save("/datasets/ScaDaMaLe/twitter/student-project-10_group-Geosmus/processedEmoticonClusterParquets/emoticonCluster.parquet")
The goal for the last part of this notebook will be to display for each country what proportion of its total tweets correspond to a certain cluster. First we create a dataframe emoticonCCDF which contains the total number of tweets with some emoticon for each country. Using that dataframe we create dataframes containing the described proportions for each cluster and transfer these dataframes from scala to python by using the createOrReplaceTmpView function.
val emoticonCCDF = emoticonDF.groupBy($"countryCode")
                             .count
emoticonCCDF.show(3)
+-----------+-----+
|countryCode|count|
+-----------+-----+
|         DZ|  157|
|         MM|   44|
|         TC|    5|
+-----------+-----+
only showing top 3 rows

emoticonCCDF: org.apache.spark.sql.DataFrame = [countryCode: string, count: bigint]
def createPropClusterDF (cluster : org.apache.spark.sql.Column) : org.apache.spark.sql.DataFrame = {
  // This function filters the emoticonDF by a cluster-column and then
  // creates a dataframe with a row per country and columns for the countryCode and proportion
  // of tweets from that country that fall into the cluster as well as the count of tweets
  // falling into the cluster.
  val nbrClusterTweets = emoticonDF.filter(cluster).count
  val clusterDF = emoticonDF.filter(cluster)
                            .groupBy($"countryCode")
                            .count
  val propDF = emoticonCCDF.alias("total")
                           .join(clusterDF.alias("cluster"), "countryCode")
                           .select($"countryCode", $"cluster.count".alias("count"), ($"cluster.count" / $"total.count").alias("proportion"))
  return propDF
}
createPropClusterDF: (cluster: org.apache.spark.sql.Column)org.apache.spark.sql.DataFrame
Below we see an example of the dataframes generated by createPropClusterDF.
val clusterColumn = $"notHappy"
val propClusterDF = createPropClusterDF(clusterColumn)
propClusterDF.show(3)
+-----------+-----+------------------+
|countryCode|count|        proportion|
+-----------+-----+------------------+
|         DZ|   80|0.5095541401273885|
|         MM|   14|0.3181818181818182|
|         CI|  164|0.6507936507936508|
+-----------+-----+------------------+
only showing top 3 rows

clusterColumn: org.apache.spark.sql.ColumnName = notHappy
propClusterDF: org.apache.spark.sql.DataFrame = [countryCode: string, count: bigint ... 1 more field]
def createPropClusterDFAndCreateTmpView (clusterName : String) = {
  // function for creating proportion dataframes for each cluster and making them available for later python code
  val propClusterDF = createPropClusterDF(org.apache.spark.sql.functions.col(clusterName))
  // make df available to python/sql etc
  propClusterDF.createOrReplaceTempView(clusterName)
}
createPropClusterDFAndCreateTmpView: (clusterName: String)Unit
// create proportion dataframes for each cluster and make them available for later python code
emoticonClusters.keys.foreach(createPropClusterDFAndCreateTmpView _)
Now we turn to python to use the pycountry package in order to translate the country codes into another standard (three letters instead of two) which makes plotting with the built in databricks display a breeze. The cell below contains some functions that read the dataframes from the temporary view created in scala and translate them to pandas dataframes with the three letter country codes. Also, we filter out countries for which there are fewer than 100 tweets.
def add_iso_a3_col(df_cc):
  cc_dict = {}
  for country in pycountry.countries:
    cc_dict[country.alpha_2] = country.alpha_3

    df_cc["iso_a3"] = df_cc["countryCode"].map(cc_dict)
  return df_cc

def cc_df_from_spark_to_pandas_and_process(df_cc, columnOfInterest):
  #df_cc should be a dataframe with a column "countryCode" and a column columnOfInterest which has some interesting numerical data
  df_cc = df_cc.toPandas()
  add_iso_a3_col(df_cc)
  df_cc = df_cc[["iso_a3", columnOfInterest]]  #reorder to have iso_a3 as first column (required in order to use the map view in display), and select the useful columns
  return df_cc

from pyspark.sql.functions import col
def createProps(clusterName):
  df = sql("select * from " + clusterName)
  return cc_df_from_spark_to_pandas_and_process(df.filter(col("count")/col("proportion") >= 100), "proportion") # filter so that only countries with at least 100 tweets in a given country are used
Finally, we can show the proportion of tweets in each country that fall into each cluster. Make sure that the plot type is set to map in the outputs from the cells below. It is possible to hover over the countries to see the precise values.
If anything interesting can actually be read from these plots we leave for the reader to decide.
display(createProps("happy"))

display(createProps("notHappy"))

display(createProps("monkey"))

display(createProps("cat"))

display(createProps("SK"))

display(createProps("prayer"))
